This section provides a summary of the CCS debug system and the debug process for a typical embedded software program.
Embedded software debugging is the process of evaluating the behaviour of an application that is placed in its target environment and subjected to different boundary conditions. The debugger and its supporting hardware elements assist in providing tight control over the execution and complete visibility over the internal aspects of the target environment, so it allows to detect errors or modify behaviours of the application.
In the CCS environment, the debug is the next step after the project build which, after a successful assemble/compile/link process, allows the application executable file to be loaded to the target environment for debugging.
For a detailed description about projects, check the chapter Projects and Build Management in the References section.
Debugging can also happen in a system that has code already loaded and running, typically on advanced stages of the product design or with a finished product. These two methods are fundamentally identical with only procedural differences that can be seen in the section Launching a debug session .
CCS can also debug an OS-hosted executable, which requires a high level operating system running on the target device/board (embedded Linux is the most common). However, the process of creating a project, building, and debugging is outside the scope of this document but references can be found in the section Linux Debug References
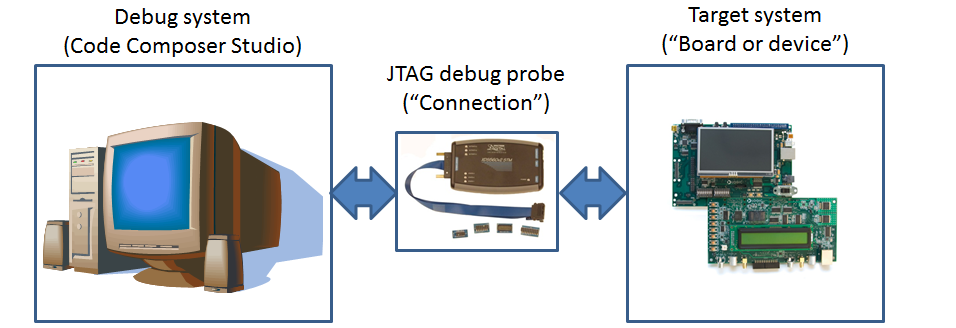
The physical debugging setup is shown above, with the two main components involved during a debug session:
This setup, when used with CCS, allows the host PC to communicate with the target, load data and code, control the execution of the program loaded via breakpoints/watchpoints and step operations, as well as read data back to the host PC to be displayed in views such as Expressions/Memory/Disassembly.
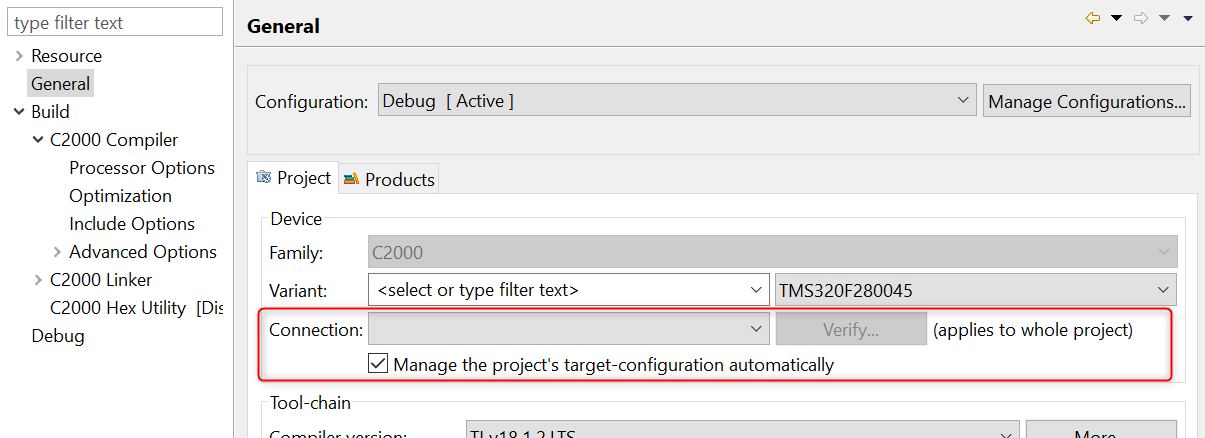
To properly make CCS aware of the physical aspects of the debugging environment, a Target Configuration File must be created. This file is populated with the appropriate Debug Probe type (XDS, ICDI or MSP-FET) and host interface (USB or Ethernet). This file also contains the exact specification of the Device or Board being used.
Once the Target Configuration File is created and all the appropriate hardware is connected and powered up, the debugger is ready to be launched.
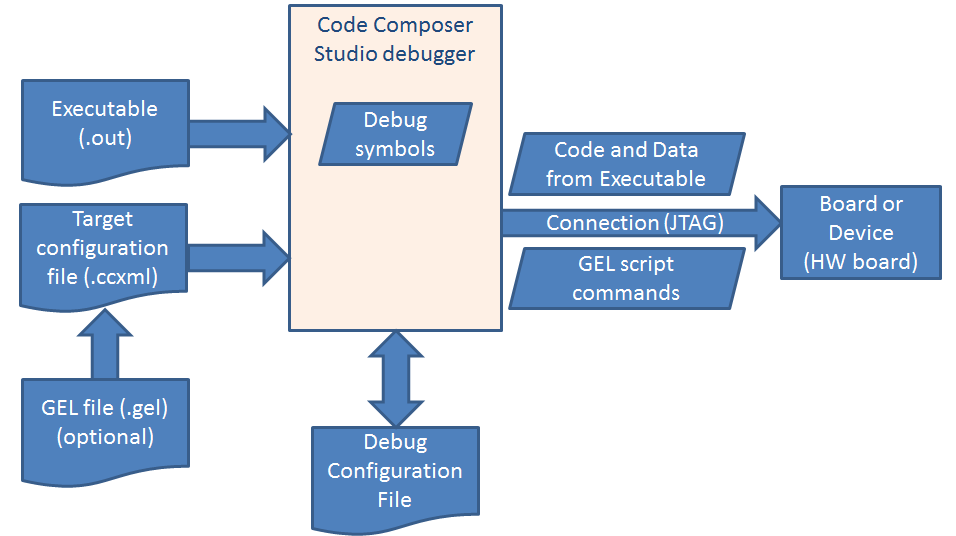
The elements of the debug subsystem are shown above and are processed in the following manner:
The last step is optional and depends on the settings present inside the Debug Configuration .
Once the launch process is finished, the debugger is ready. It keeps the target halted - waiting for additional interaction and inspection from the user.
The iterative process of debugging and modifying the application can be done by simply rebuilding the project and reloading the code to the target.
This section covers in detail the two elements responsible for the debugger configuration in CCS: Target Configuration Files and the Debug Configurations.
As mentioned in the Debug Overview section, Target Configuration Files are responsible for describing the physical aspects of the debugging environment.
The Target Configuration File is a plain text XML file, with a .ccxml extension, that contains all the necessary information for a debug session: the type of Debug Probe, the target board or device (or even multiple devices), and (optionally) a path to a GEL (General Extension Language) script, which is responsible for performing device and/or hardware initialization.
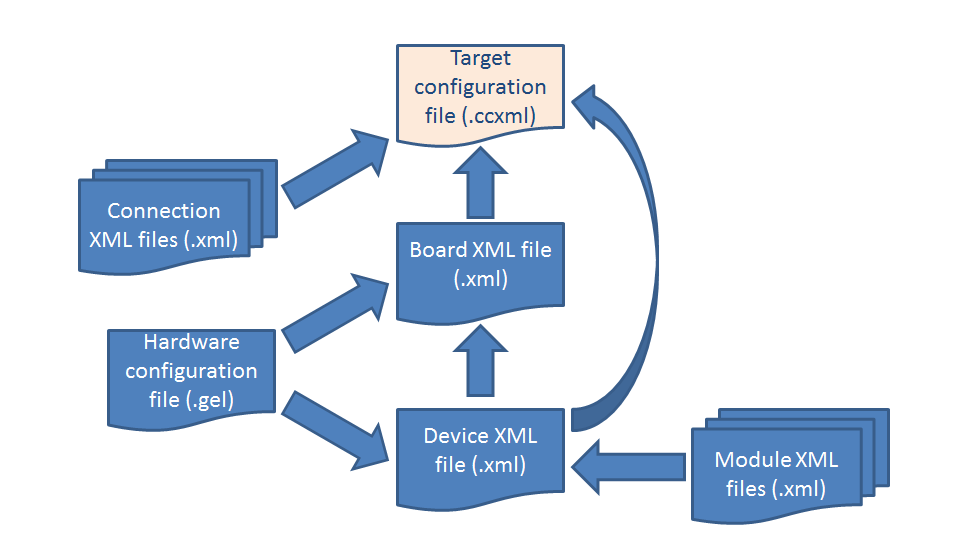
As shown above, the Target Configuration File includes one or more connection XML files (one per each core and JTAG entity, but all of them tied to the chosen Debug Probe) and either a Board XML file (which contains a Device XML file plus the GEL script for the board) or a Device XML file directly (which may or may not contain a GEL script). The Device XML file contains the internal JTAG structure of the device and can optionally include several Module XML files, which describe a device’s peripheral registers.
Despite the complexity, there are two simple ways to create the Target Configuration File: Automatically or Manually.
This method automatically creates a Target Configuration File when creating a project or modifying its properties.
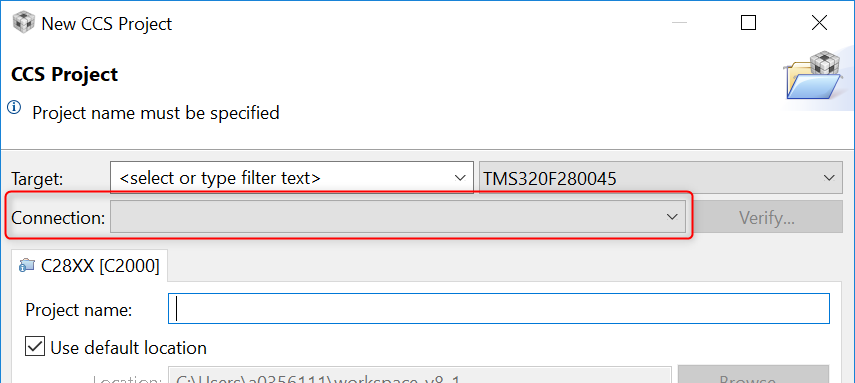
To create it, simply find out which Debug Probe model (XDS, ICDI, MSP-FET) and interface (USB, Ethernet) is used by your hardware and set this parameter in the drop-down menu Connection in the New Project Wizard or Project settings.
This method creates a Target Configuration File by manually invoking the Target Configuration Editor.
The Target Configuration Editor is a GUI inside Code Composer Studio that allows creating and modifying Target Configuration Files. It also allows configuring advanced aspects of the Debug Probe and the target, as well as creating configurations for complex devices (with multiple cores) and boards (with multiple devices in the same scan chain).
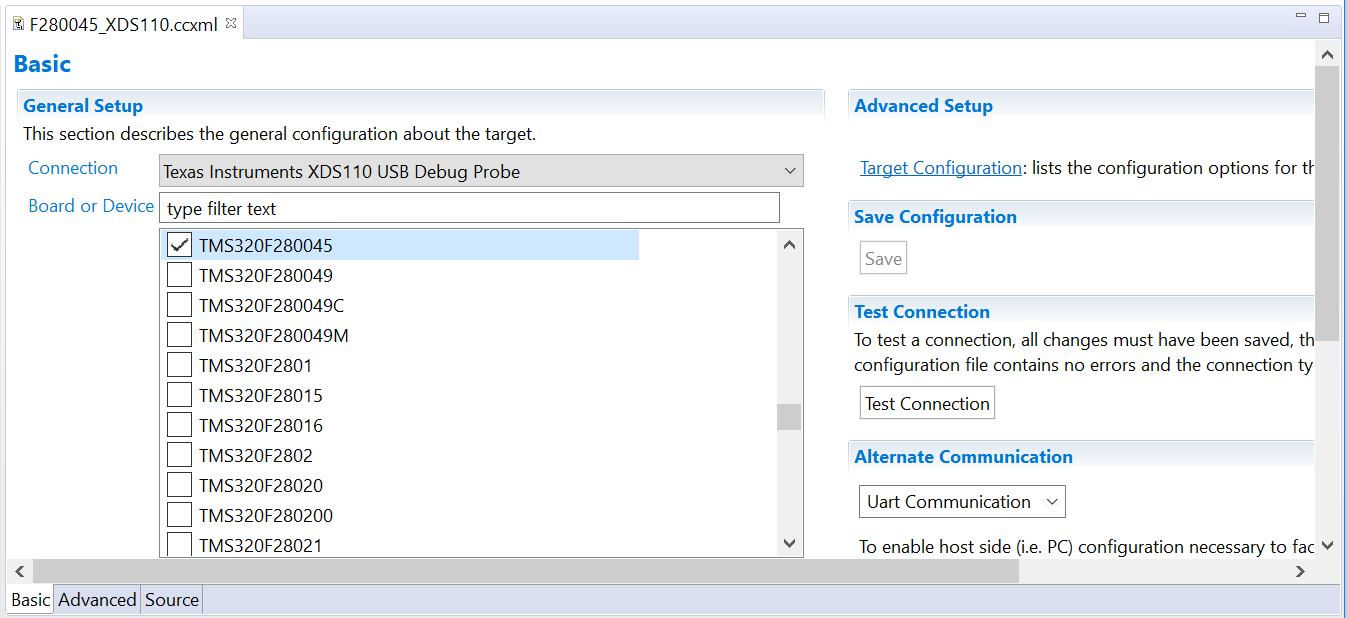
To create the Target Configuration File manually, simply launch the Target Configuration Editor from one of the several places inside CCS:

Once the Target Configuration File is created and saved, you can use the Test Connection button to verify that the JTAG connection is working at the lowest level. This button will execute various low level JTAG tests on the configured device.
If the button is grayed out, it means that either the Target Configuration File has not been saved or the connection type being used is not supported (such as non XDS based connections such as MSP-FET430UIF or Jlink).
To see a video demo on how to test the connection, check the How to test your JTAG connection with CCS in the References section.
The procedure above mostly covers the Basic tab of the Target Configuration editor, but other two tabs are also important:
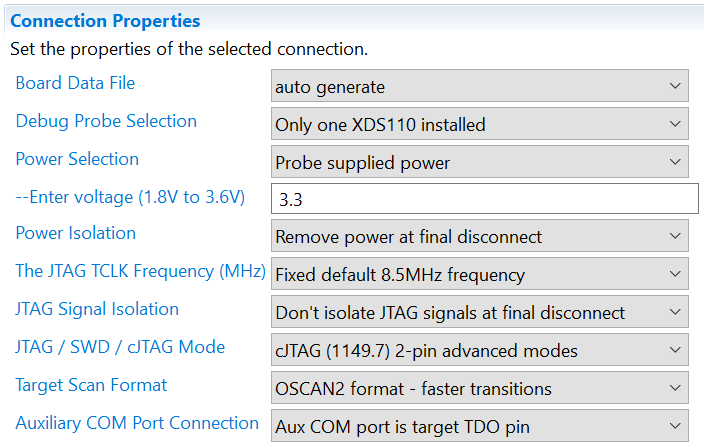
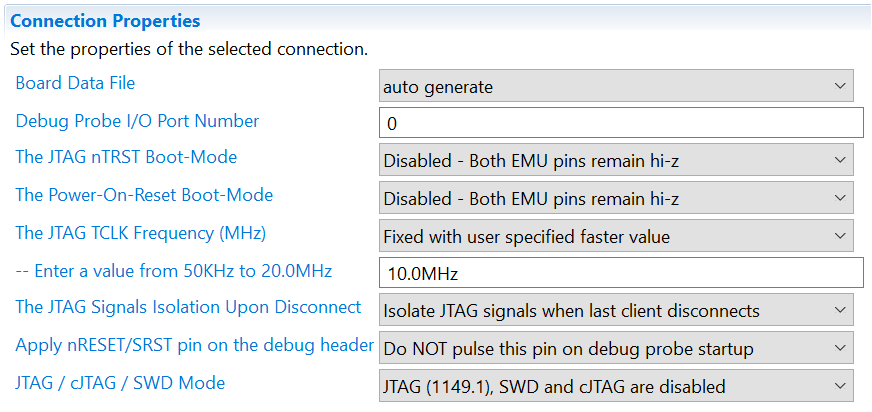
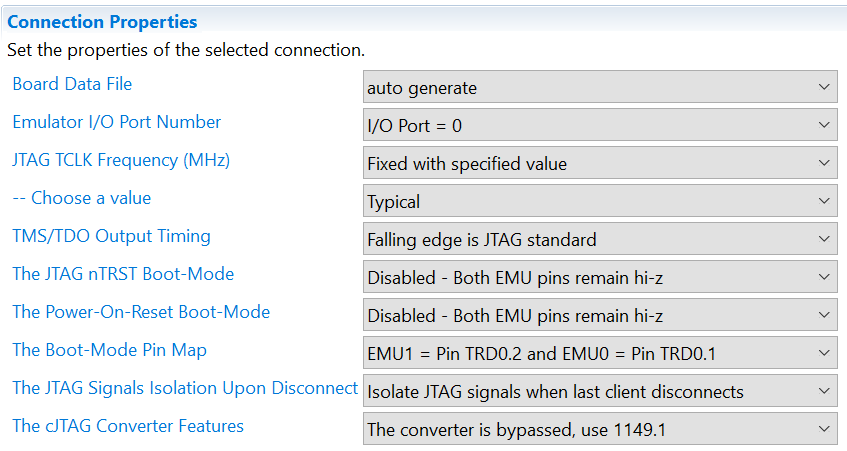
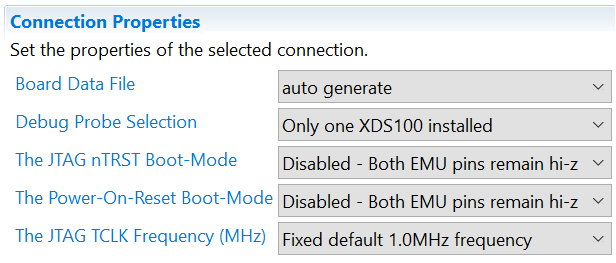
The Advanced tab allows configuring important parameters of the Debug Probe (mode of operation, clock speed, special signaling, endianness, among others), the device’s internal JTAG structures (addresses, ports, cores), and the addition/removal of GEL startup files.
The Source tab shows the XML code of the Target Configuration File with all references to the XML files mentioned at the start of this section. This XML source is auto-generated and it is not recommended to manually modify it.
Check the section Advanced Debug Probe Configurations for a complete list of advanced configurations of each debug probe.

Target Configuration files can be tagged as Active or Default. This tagging affects which configuration the Debug launch button will use. The Debug launch button will search for and use a Target Configuration File in the order below:
One exception is if you have a Target Configuration File opened in the editor and in focus. In this case, the Debug launch button uses it instead of the Default or Active Target Configuration File.
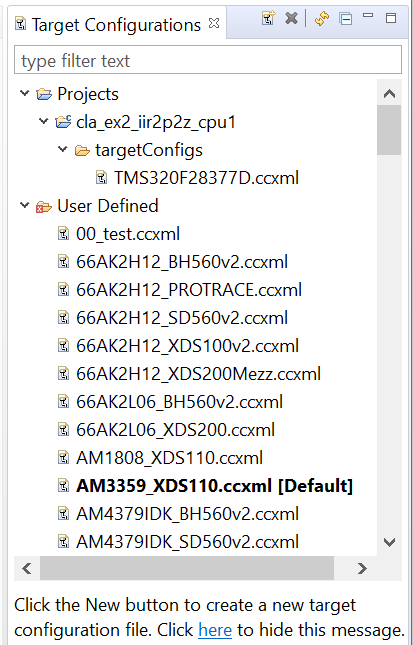
The Target Configuration view will display all target configuration files associated to the workspace. Target configurations can be easily managed from this view, including renaming/opening/deleting configurations, setting a configuration as the Default, linking a configuration to an existing project, and so on.
The top toolbar contains the following buttons:

The right-click context menu contains the following options:
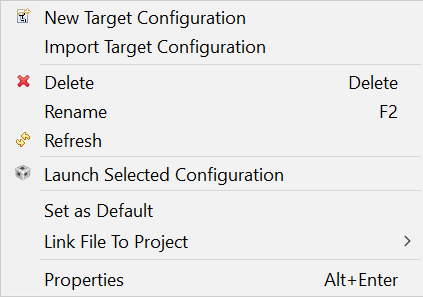
Most of the options are self-explainable apart from three of them:
Video demo: The short video How to use the CCS Target Configuration view demonstrates the features listed above.
Information about the settings required to configure the Launchpads and other development kits can be found at the Common target configurations page
A Debug Configuration (sometimes also called Launch Configuration) is the way that standard Eclipse (and by extension, CCS) describes how to launch a program in Debug mode. See the Eclipse FAQ about Launch configurations: What is a launch configuration?
Debug Configurations are unique for each workspace. A Debug configuration can be manually created by going to menu Run → Debug Configurations, or it is automatically created when the debugger is launched. Debug configurations may be cached and reused for future sessions that use the same configuration.
The name and physical location of the debug configuration is determined by how the debugger is launched.
One of the advantages of directly editing the Debug Configuration is to automate tasks when loading code to complex devices that have multiple cores. The short video Multicore debugging made easy shows this process.
You can also create and assign a different debug configuration for each build configuration of your project. The short video Customizing debug launch for different build configurations shows the process.
The Debug Configuration contains various settings separated by the following tabs:

Main: Configures the main options for the debugger.
Program: Configures the main options for program loading.
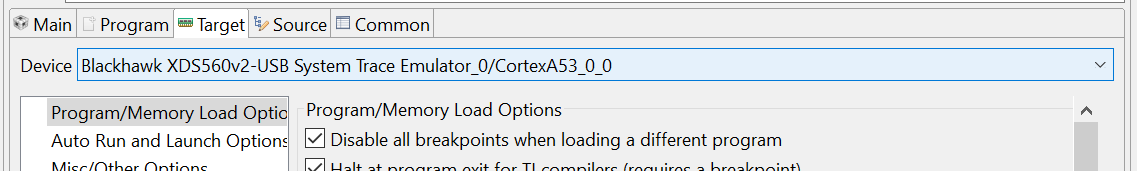
Target: All the options in this tab are described in the section Debug Properties .
Source and Common: All the options in this tab match the standard Eclipse options which are described in the online Eclipse help at Using Run/Debug Configurations
Sometimes it is desirable to share project debug/launch configurations along with the project. In such cases, it is recommended to avoid absolute paths to help with “portability”. While relative paths are not supported in debug/launch configurations, it is possible to avoid absolute paths with the use of some default variables to reference files related to the project. For details, check the topic below: Portable target and debug configurations
There are many settings that define the debug properties, such as Program/Memory Load Options, Auto Run and Launch Options, and On-Chip Flash settings, to name a few. This section describes the more commonly used debug settings.
These settings can be viewed and customized through:
Note that if you are using the first option above, you need to have already specified a Connection in your Project Properties in order for the Debug Properties to be populated. If you do not explicitly have a Connection specified, it may use the Default target configuration file and show the Properties based on that file which may be incorrect/not match up with your device, so make sure you have the correct Connection selected for your project.
For multi-core devices, make sure the Device drop-down shows the relevant core, for example as shown below for IDK AM65x:
These settings can also be accessed, when already in a debug session (and in the CCS Debug perspective), either by going to:
The Debug properties are displayed under several categories. Each category allows you to control certain settings related to that category. Most users will not need to modify the default settings. The default settings are optimally chosen based on the processor being debugged, hence they may vary slightly by processor. For example, the default settings for MSP430 may be different than those for F28x.
This category defines settings related to program/memory loading, verification options, connection options, disabling interrupts, and resetting/restarting target during load.
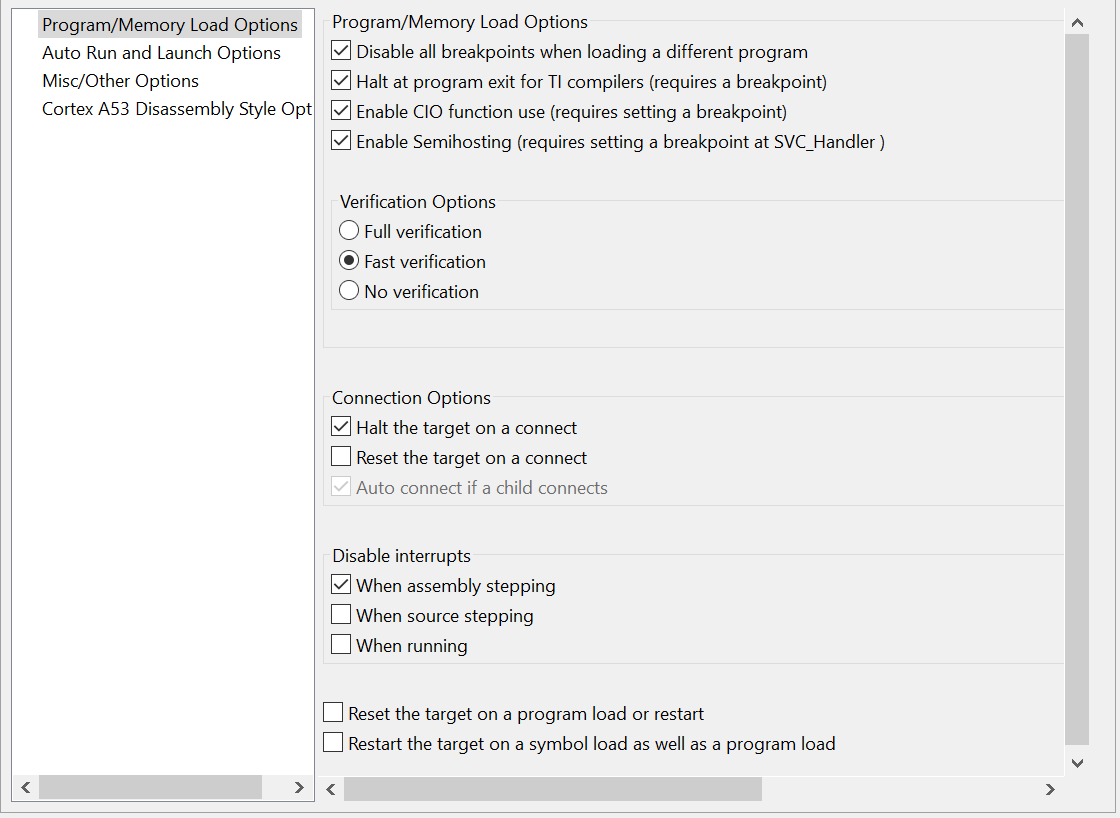
Program/Memory Load Options:
Verification Options: After the code/data is loaded to the device, sets the level of verification performed on it. This is done by reading back the code/data from the device's memory and comparing it to the executable on the host. The choices are:
Connection Options: These settings control actions performed immediately after the Debug Probe connects to the target device. The choices are:
Disable interrupts: These settings control whether to disable or enable interrupts when stepping and/or running code. The options are self-explainable.
Reset the target on a program load or restart: Issues a soft reset on the target device when a program is loaded or restarted.
Restart the target on a symbol load as well as program load: Issues a restart when either symbols or a program is loaded to the target device. A Restart simply re-positions the PC register to the entry point (typically `` _c_int00``(TI Compiler) or the reset vector).
This category defines Realtime Options, Auto Run Options, and Launch Options.
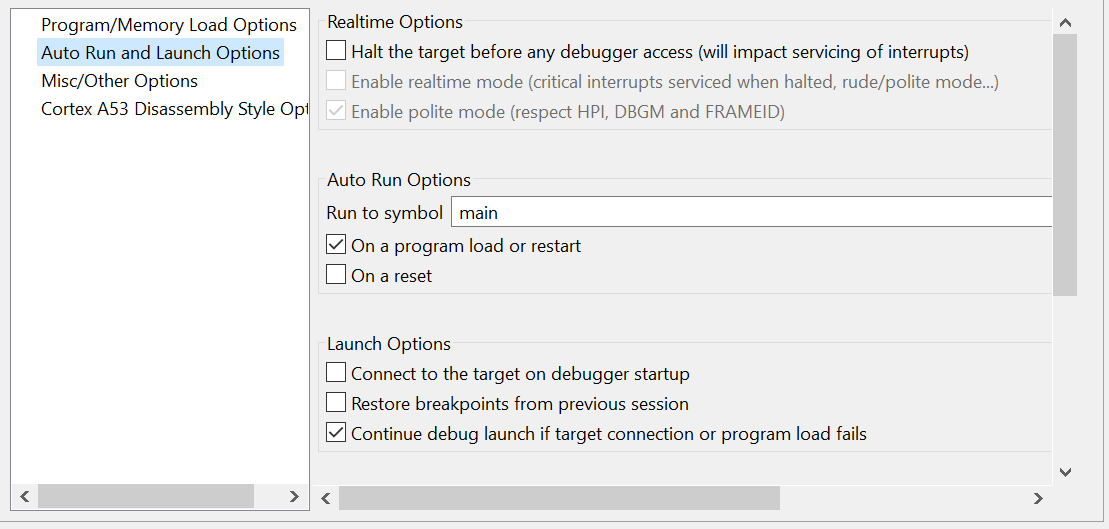
Realtime Options: These options control real-time access to the target device.
Auto Run Options: These options control which condition will cause the debugger to automatically run to and halt at the pre-defined symbol. By default, this symbol is set to run to main() On a program load or restart.
If an invalid symbol is specifed, or the target is unable to reach the specified symbol location, the target will run immediately after the code is loaded and left in a running state.
Launch Options: These options control the actions taken automatically when the debugger is launched.
This category defines OS Aware debug Options (when doing OS Aware debugging) and other miscellaneous options.
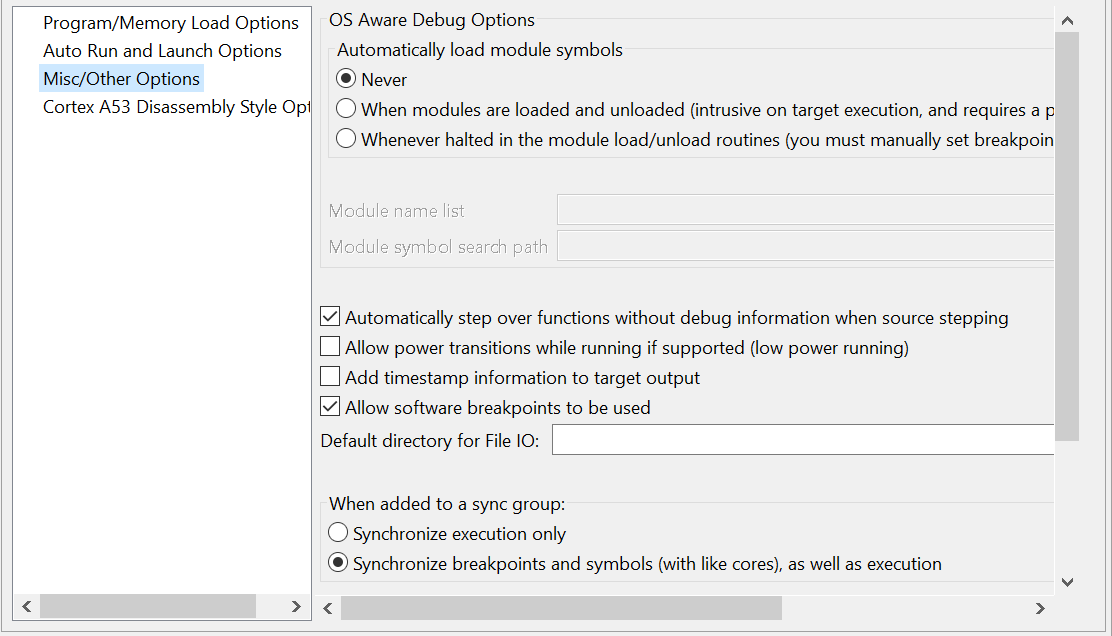
OS Aware Debug Options: These options control the Debugger awareness level when used with a High Level Operating System, such as embedded Linux or Android.
Automatically step over functions without debug information when source stepping: Enables a Step Over operation if the function does not have symbols and source code loaded into the debugger. If disabled, the debugger performs an Assembly Step Into for these functions.
Allow power transitions while running if supported (low power running): Maintains the JTAG Debug Probe connection when the target device goes through a power transition or reset. This is heavily dependent on the device and board capabilities.
Add timestamp information to target output: Adds timestamps to operations in the target that print out information in the Console View ( GEL , Console I/O, etc.)
Allow software breakpoints to be used: Enables the use of Advanced Event Triggering (AET) resources to enable software breakpoints to be used when allowed by the target device. This is advantageous given that hardware breakpoints are limited in number by the target device, while software breakpoints are completely unlimited.
Default directory for file IO: Sets the default directory for any File I/O operations.
When added to a sync group: These options control the level of interaction when synchronized execution (Sync Group) is enabled. This is dependent on the target device and is effective with Symmetrical Multi Processing (SMP). Check the document SMP Debug with CCS in the section References .
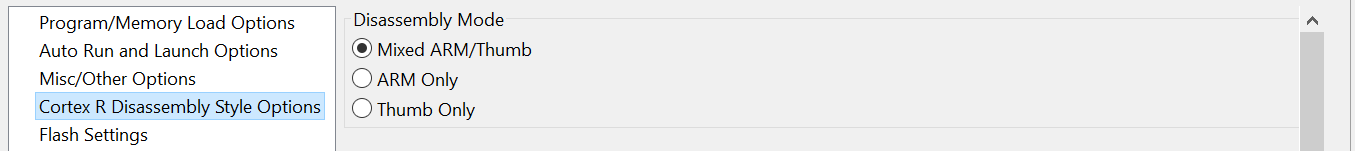
This category is only applicable for ARM7, ARM9, Cortex R/A devices and sets the mode in which instructions are displayed in the Disassembly View .
Cortex R4, R5, A8, A9 and A15:
Cortex A53:
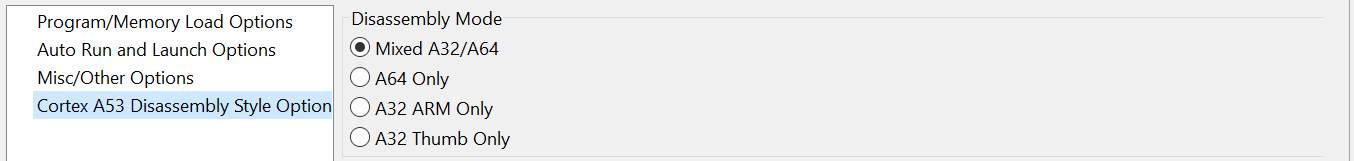
The default is Mixed ARM/Thumb or Mixed A32/A64 and automatically selects the mode depending on the core mode (the CPSR/xPSR register).
This category is only applicable for F28x devices and sets the mode for the Disassembly View .
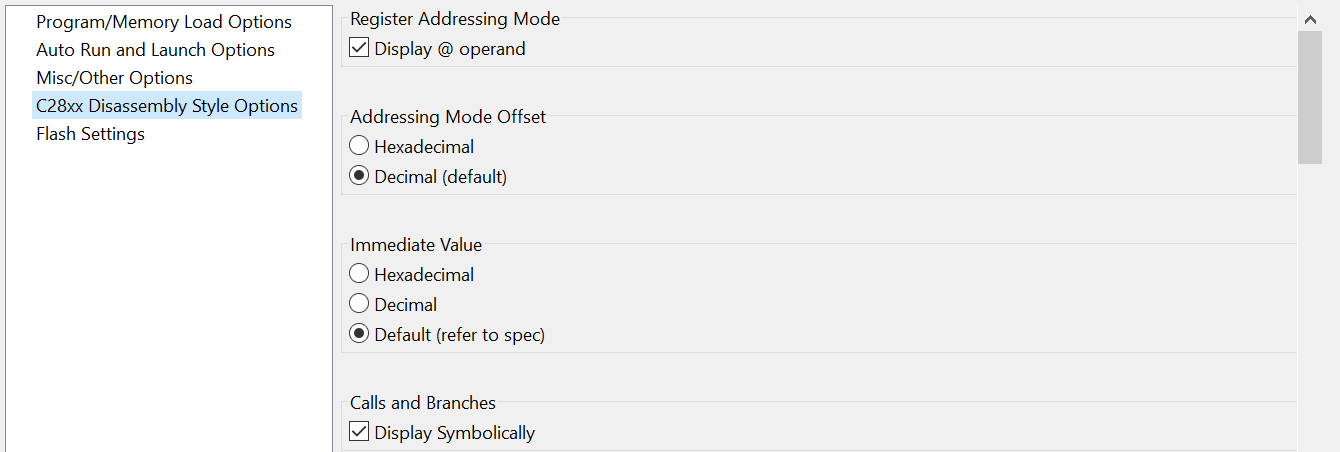
The default options are shown above.
This category defines several flash memory related settings and operations that are described in more detail in the section Configuring Flash Settings .
This category is only applicable for MSP430 and sets several debugger options:
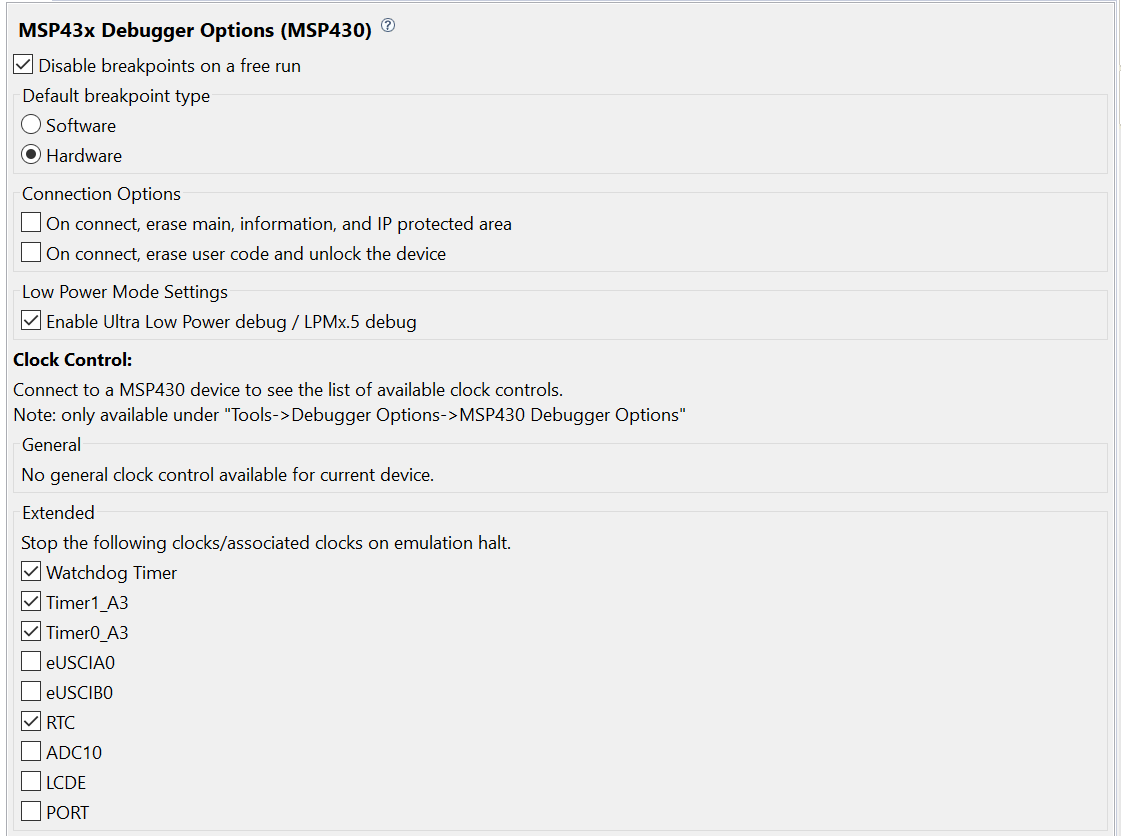
Disable breakpoints on a free run: Disables all breakpoints when the Free Run option is used. For certain devices, Free Run is a less obtrusive mode of running the device through power transitions and low-power modes.
Default breakpoint type: Sets which default breakpoint will be used. Hardware breakpoints are mandatory for code located in Flash or ROM, thus this is the default option for this device.
Connection Options: These options set the actions performed by the debugger during connection.
Low Power Mode Settings: Maintains the JTAG Debug Probe connection when the target device goes through a ULP mode.
Clock Control: Allows full control over the clocks that are stopped upon emulation halt. The debugger must be connected to the target device to get a list of available clocks.
Additional details can be seen at the document CCS IDE for MSP430 MCUs
Once a configuration is created, the debugging process can be launched either automatically (Automatic Launch) or manually (Manual Launch):
This process launches a Project-based debug session. Simply highlight the project in the Project Explorer view and do one of the following options:
If a project has multiple target configuration files, the Active configuration of the project will be launched.
This will perform the sequence of steps shown in the section The Launching Process . In summary:
The code will be automatically written to the on-chip flash memory of the Simplelink MCU, MSP430, F28x, Hercules and Digital Power devices. To configure the flash loader properties, check the Debug Configurations or the Flash Settings .
Launching the debugger will cause CCS to build the active project if any modifications to the source code or the build options are made.
This process launches a Project-less debug session. Simply highlight a Target Configuration File in the Target Configurations view and do one of the following options:
If no target configuration file or project is highlighted, the Default configuration of the workspace will be launched.
This will perform the sequence of steps shown in the section The Launching Process . In summary:
Launching the debugger manually can be useful in many scenarios:
For a project-less debug session, CCS may sometimes not be able to locate the source files to do the source-disassembly correlation. In such cases, there are a couple of ways to tell the debugger where to look for sources. Please see the section Debugging Library Code .
The process of debuggging the application requires multiple features and helper views that allow complete control over the execution state of the target. Also, many data views complete the picture by exposing the status of the various subsystems of the target. This section describes some of these views and features.
After launching, the Eclipse perspective is switched from the CCS Edit ![]() to the CCS Debug
to the CCS Debug ![]() (indicated at the top right corner of the Workbench), with the default arrangement of views shown below.
(indicated at the top right corner of the Workbench), with the default arrangement of views shown below.
The display contents can greatly vary depending if changes were done in a prior run or if a different Debug Probe, target, and code are used.
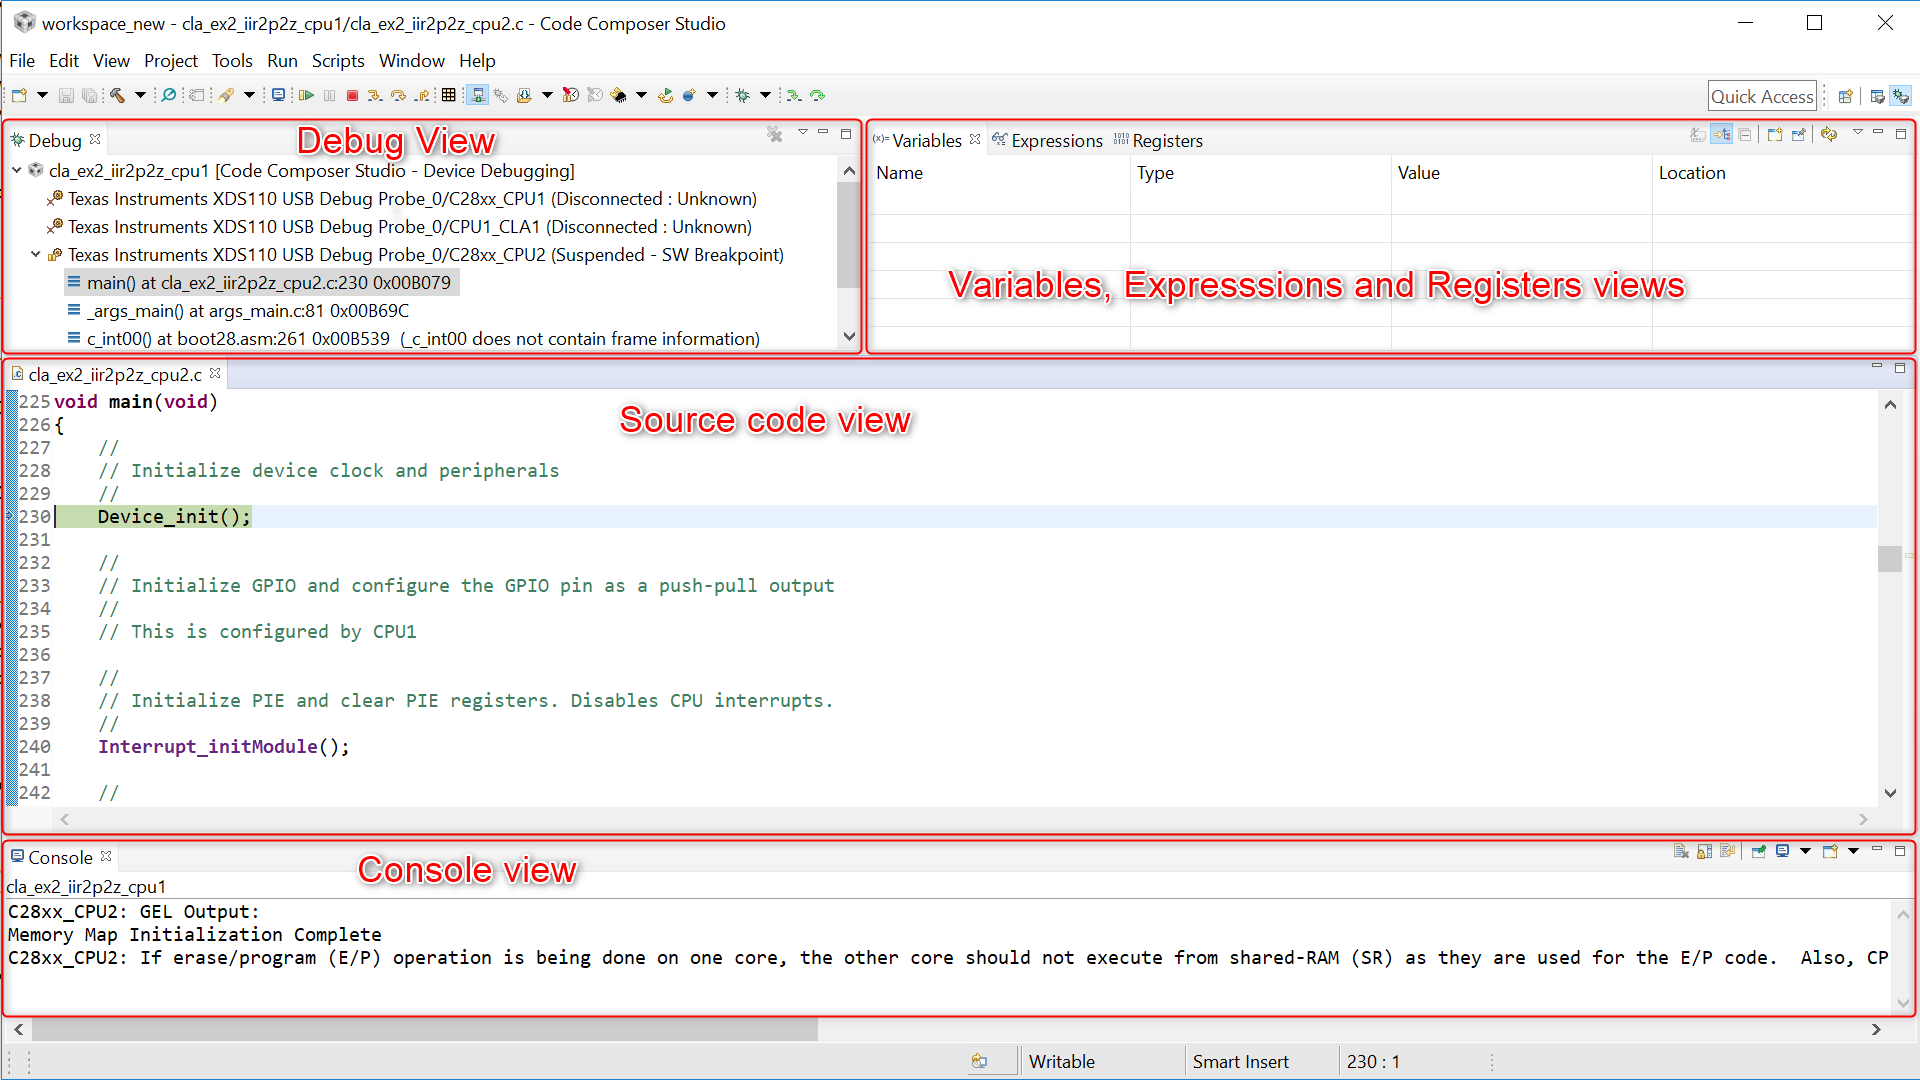
Basic debugging functionality is located in the bar at the top of the Debug view.

Hidden from the bar is an addition option called *Free Run. This option will run the target and then detach the debug connection. The behavior of the run would be similar to as if the physical JTAG connection was disconnected. This type of run behavior would prevent the periodic polling of the debugger for the target status. Any breakpoints set by the debugger on the target would also be disabled.
The extended bar shows advanced debugging tools in addition to the basic ones above.

These toolbar functions are also available in both the menus Views and Target, which also feature several additional options.
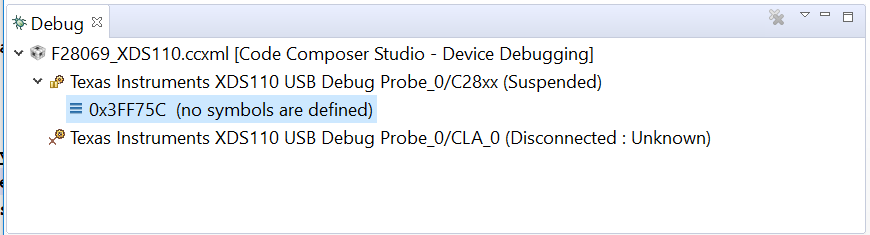
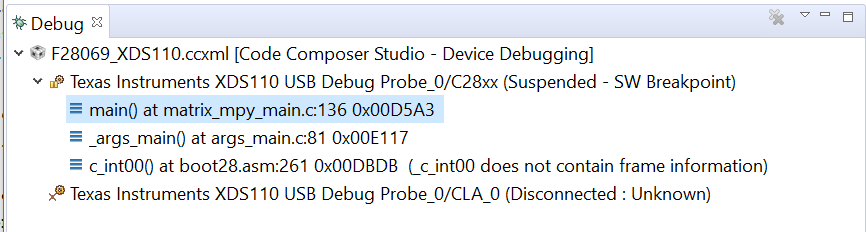
The Debug view is the most prominent view when the debugger is launched. It is opened by default.
Without a program loaded:
With a program loaded:
It contains several areas:
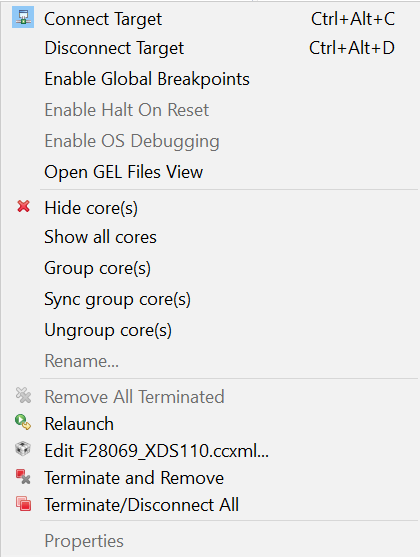
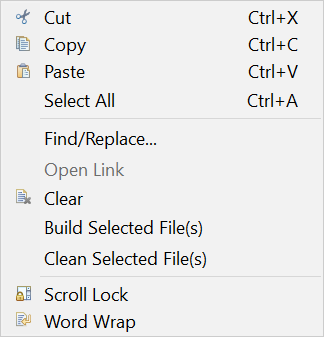
Right-clicking on it shows the following context menu:
The cluster of tabbed views named Variables, Expressions, and Registers is opened when the debug session is launched.
The Variables view shows only local variables that belong to the function currently being executed.
Variables that contain more than one element (such as arrays, structures, or pointers) are displayed with either a plus sign (+) or minus sign (-) immediately preceding the expression name.
Variables whose values have changed since the last time they were seen are highlighted in a yellow background. Whenever the situation permits it, the value of a variable may be modified by clicking its Value column and entering a new value.
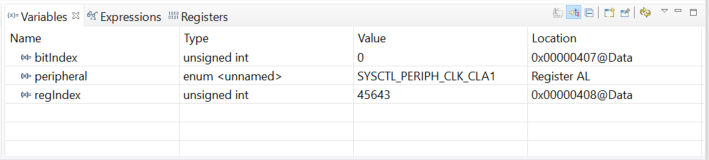
It consists of the following columns:
This view does not allow adding or removing rows, since it is automatically populated by the variables present on the context of the program being debugged.
The toolbar contains several formatting options.

The options are:
Right-clicking on a given variable shows the following context menu:
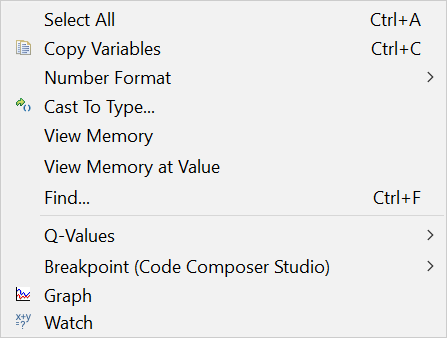
The options are:
The Expressions view is a typical watch window where variables (local, global, static), C-valid expressions, and even registers can be monitored.
Expressions that contain more than one element, such as arrays, structures, or pointers, are displayed with either a plus sign (+) or minus sign (-) immediately preceding the expression name.
Expressions whose values have changed since the last time they were seen are highlighted in a yellow background. Whenever the situation permits it, the value of an expression may be modified by clicking its value column and entering a new value.
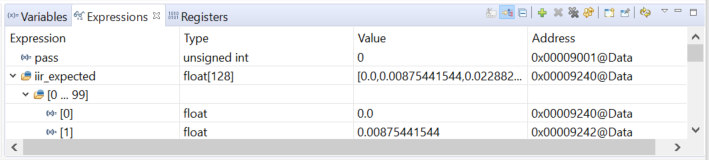
To add a variable, simply select the column that reads Add new expression and type a valid expression.
It consists of the following columns:
The toolbar contains several formatting options.

The options are:
Right-clicking on a given variable shows the following context menu:
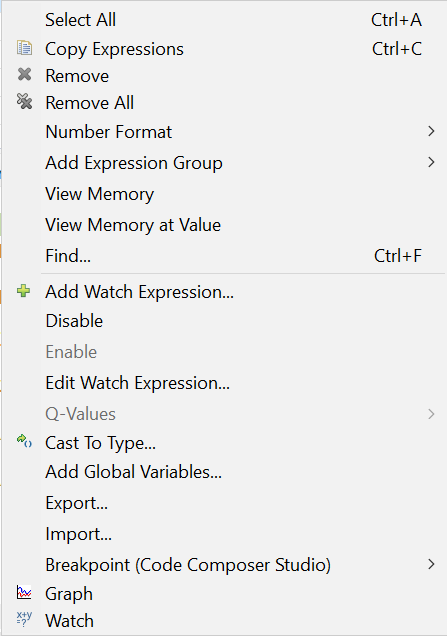
The options are:
The Registers view allows viewing and editing the contents of core and peripheral registers of the device, including bitfields and individual bits. Register values that have changed are highlighted in a yellow background. To change a register or register bit field value, single click in the value column of the register and modify it. This is only allowed for registers that are not read-only.
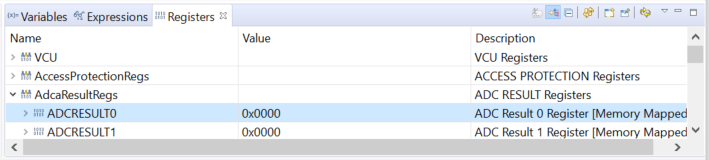
It consists of the following columns:
This view does not allow adding or removing rows, as they are automatically populated with the device information.
The toolbar contains several formatting options.

The options are:
Right-clicking on a given register, bitfield or bit shows the following context menu:
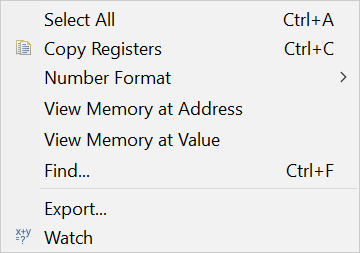
The options are:
The Disassembly view is an integral part of the debugger that translates machine language into assembly language, as it displays the disassembled instructions and symbolic information needed for debugging. This view is not opened by default but can be viewed by going to menu View → Disassembly, unless there is no loaded program or there are no debug symbols attached to the program.
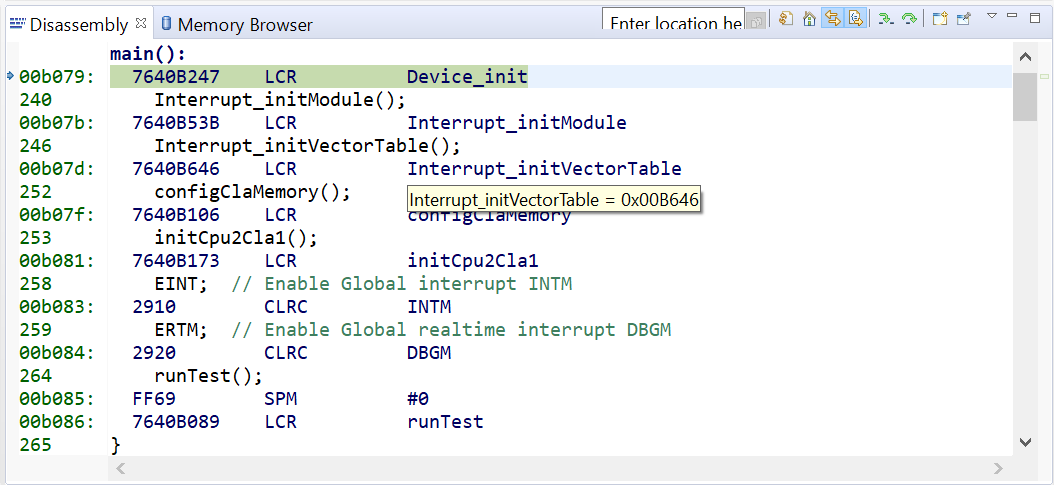
The Disassembly view contains several fields in its default configuration:
Many other features can be displayed depending on the options enabled.
The toolbar contains several functions:

The options are:
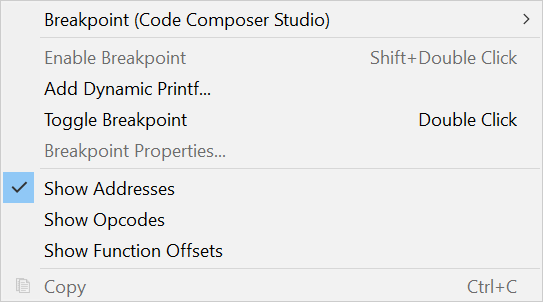
Right-clicking on the main view shows the following context menu:
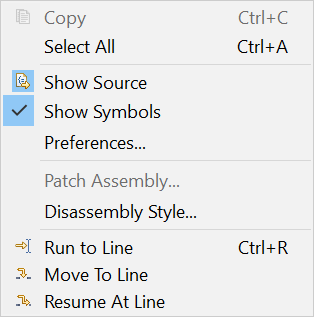
The options are:
Right-clicking on the address view shows the following context menu:
The options are:
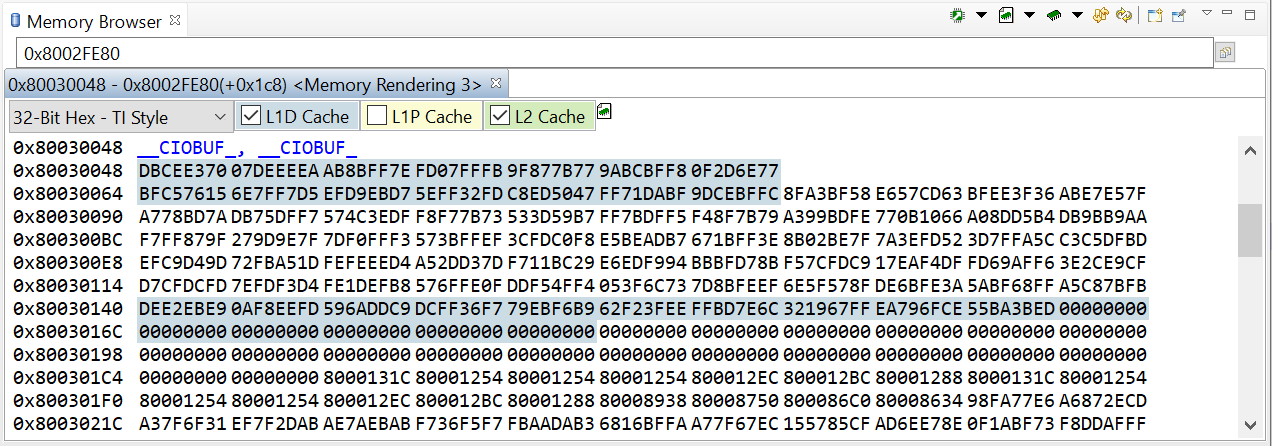
The Memory Browser view is another integral part of the debugger that shows the contents of the target memory starting at a specified address and with various data formatting features. The memory view is not opened by default but can be viewed by going to menu View → Memory Browser.
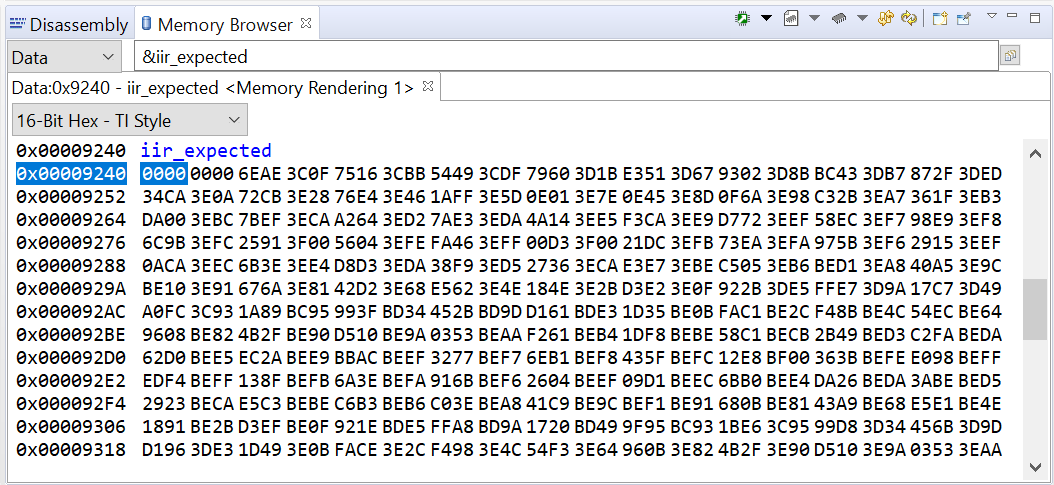
It features multiple viewing formats and types: char, integer (signed/unsigned), float and multiple Hexadecimal data sizes (8 through 64-bits). Additional capabilities include: memory fill with predefined values, save to/load from files in the host PC, all the variables and functions can be viewed, and every memory position has a context-sensitive information box.
In certain architectures it can also display cache information:
To use it, simply enter a starting address in the Address Text box at the top of the view and select the appropriate memory page of the device.
F28x MCUs, C5500 DSPs and PRU cores have separate code, data and I/O memory pages.
The contents of a selected memory location can be edited by double-clicking the value.
Multiple instances of the Memory view can be displayed simultaneously, allowing comparisons of memory contents.
The toolbar contains several functions:
The options are:
Right-clicking on the memory view shows the following context menu:
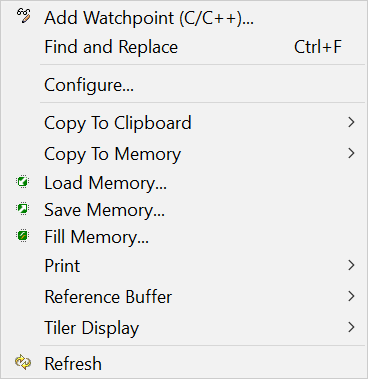
The options are:
The Load Memory dialog is shown below. The Save Memory dialog is very similar.
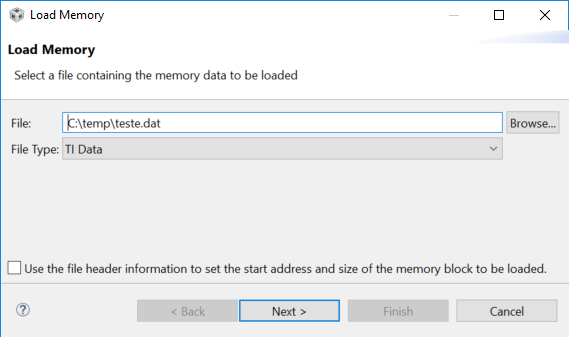
It supports several data formats and settings:
For additional information about the various data formats supported by the Save Memory function, please check the section Data File Formats .
The Fill Memory dialog is shown below.
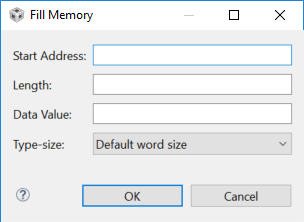
The options are:
The Console view is another integral part of the debugger that shows several informative messages of the debug session. It is not opened by default but it is usually shown as soon as the Debug Session starts to show various status and progress messages.
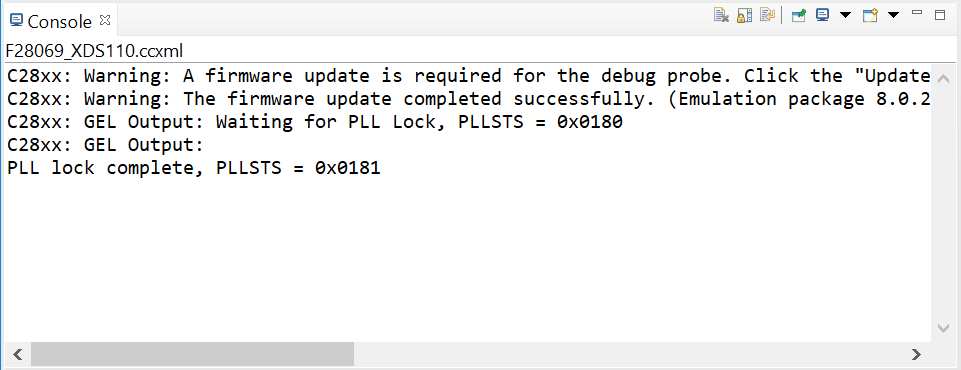
Among the several messages it can display are:
For multi-processor environments, there is the possibility of having multiple Console views tied to each core.
The toolbar contains several functions:

Right-clicking on the Console view shows the following context menu:
Breakpoints are one of the most basic features in any debugger, allowing the execution of the processor or core to halt at a pre-defined place in the code.
Breakpoints can be set at a line in a source file, which gets translated to an address in the device memory, or directly at an address in the Disassembly View . They can also be set on a method in the Outline or Project view.
They are displayed at the left side of the source editor view (in the vertical editor ruler, together with line numbers, code folding symbols, and others) and in the Breakpoints View .
Breakpoints can also be enabled or disabled via the context menu in all the views. An enabled breakpoint causes a thread to suspend whenever the breakpoint is encountered. Enabled breakpoints are shown in blue and have a checkmark overlay once successfully set up by the debugger (Software breakpoint:  , Hardware breakpoint:
  ). A disabled breakpoint does not cause threads to suspend and are greyed out in all views.
There are two types of breakpoints: Software and Hardware.
A Software breakpoint is implemented as an opcode replacement. The debugger modifies the opcode by inserting an estop_0 instruction where the previous instruction was. The program counter stops immediately before it executes the software breakpoint instruction. In general this instruction is hidden from the main interface, but in certain instances this instruction is displayed in the Disassembly View .
Software breakpoints can only be set in memory regions with write access (RAM), therefore there is no theoretical limit to the number of software breakpoints that can be used.
A Hardware breakpoint is implemented internally by the target hardware. The method used to do this is heavily dependent on the device or core, but typically the debugger writes the address to a register on the device and sets a flag to enable breakpoints. These registers are not exposed to the IDE.
A hardware breakpoint can be set in any memory type (RAM, Flash or ROM), but it is limited by the number of registers on the device. This is mandatory for the types of console I/O devices.
Hardware breakpoints can also have a count, which determines the number of times a location is encountered before a breakpoint is generated - e.g. if the count is 2, a breakpoint is generated every second time.
A special category of hardware breakpoints is called a Watchpoint , which are breakpoints triggered by memory accesses instead of instruction acquisitions.
In addition to simply halting the code, breakpoints in CCS add a range of other actions such as file I/O transfers, screen updating, etc. and accessible via the Breakpoint Properties .
To set a breakpoint, simply double-click on the left side of either the line number in the source code view or the address in the disassembly view. The debugger will check the debugger memory map to determine if the specified location is writable (RAM). If so, a software breakpoint will be used. If it is determined tha the location is not writable (Flash, ROM), then a hrdware breakpoint will be used.
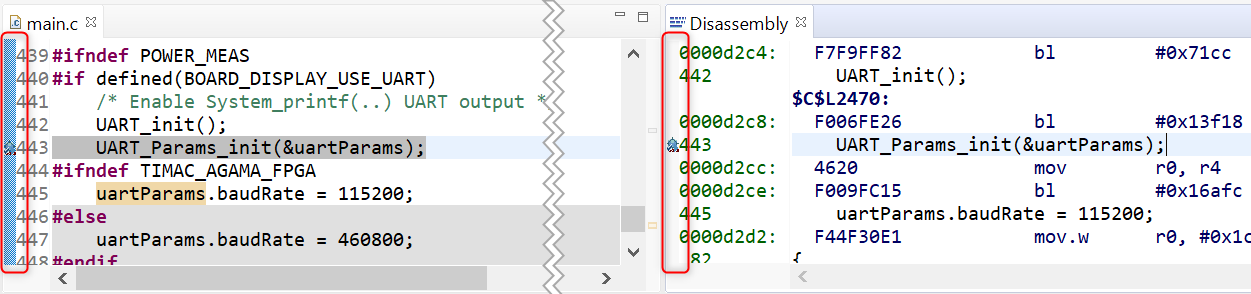
In optimized code, the breakpoint may not be set to the exact line in the C source code. This is because the optimizer may condense code and impact the correlation between the assembly instruction and the C source.
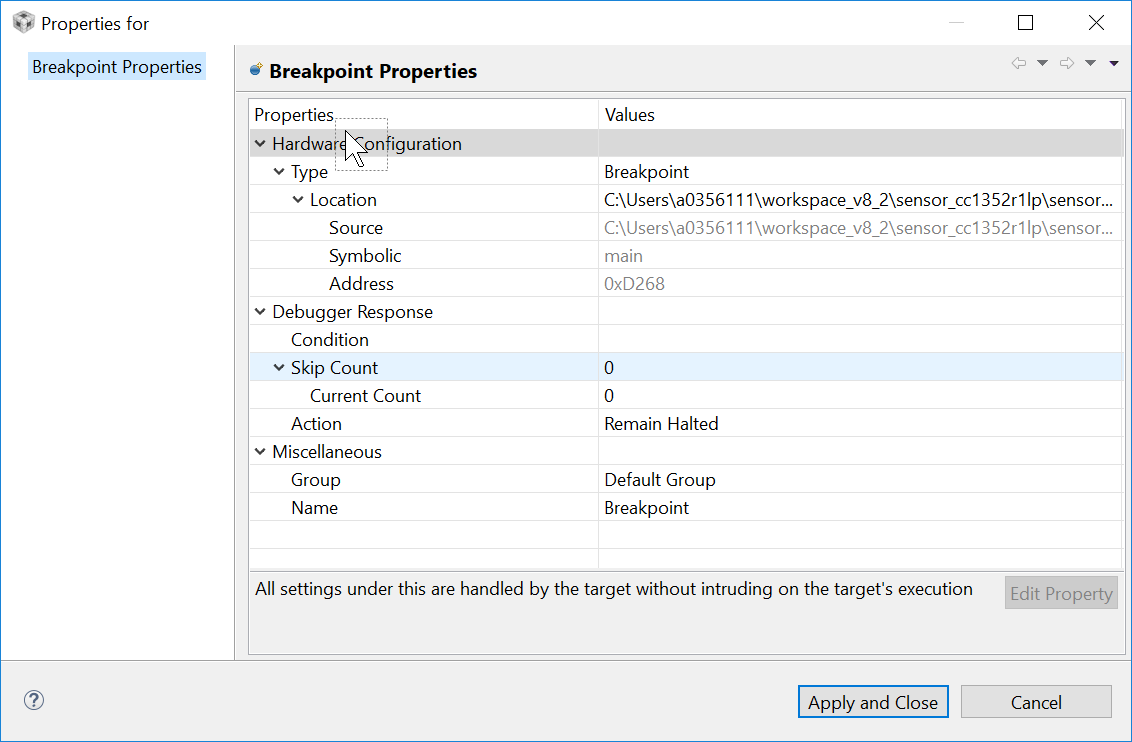
Breakpoint Properties shows all details of a breakpoint (address location, related source code, type) and allows modifying the associated behaviour (actions, counter, type of event). If you have placed your cursor in the Breakpoint view window, you can right-click on a breakpoint and select Properties from the context menu to see a more detailed property list. The Breakpoint Properties are saved in the workspace, so you do not need to reset them in between debug sessions. You can modify any breakpoint property even after the breakpoint has been created.
In addition to simply halting the code, software breakpoints in CCS add a range of other actions such as file I/O transfers, screen updating, etc. which are accessible via the Action option of its properties.
The options under Debugger Response apply to software breakpoints only. They have no effect with hardware breakpoints and watchpoints.
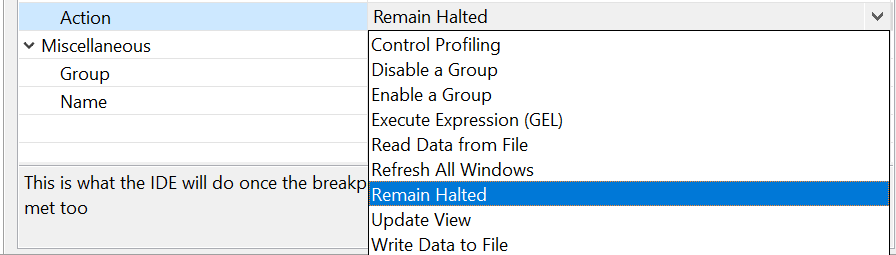
Some of these actions open a new of parameter options immediately below the Action field. The choice of parameters will depend on the chosen action.
The main actions are:
Other breakpoint properties configurable are:
Watchpoints are a special category of hardware breakpoints that can be triggered for a particular memory read, memory write, or both memory read or write. Watchpoints are only shown in the Breakpoints View .
Watchpoints are extremely useful to catch exceptions, invalid memory boundary accesses, overrun buffers, etc. and can be set to access any memory region, including Memory Mapped Registers (MMR).
To set a Watchpoint, simply highlight a variable on the source code editor, right click and select Breakpoint → Hardware Watchpoint. It can also be set by clicking on the small blue dot in the Breakpoints View toolbar.
Conditional breakpoints are a special type of software breakpoint that is only triggered when a specified condition is true. It is displayed with an overlay on the breakpoint icon.
To set a condition on a breakpoint:
While the breakpoint is enabled, target execution suspends before that line of code is executed if the breakpoint condition evaluates to true.
Hardware breakpoints leverage watchpoints and hence conditional watchpoints can be used instead.
The Breakpoints view is an integral part of the debugger that allows complete management of Breakpoints , as well as other extensions such as Watchpoints , Event Counters, among others. The Breakpoints view is not opened by default but can be viewed by going to menu View → Breakpoints.
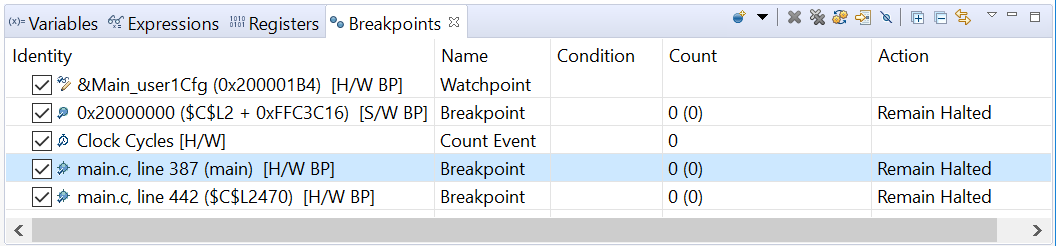
The view above contains the status of all breakpoints and allows configuring their properties directly via context menu (right-click).
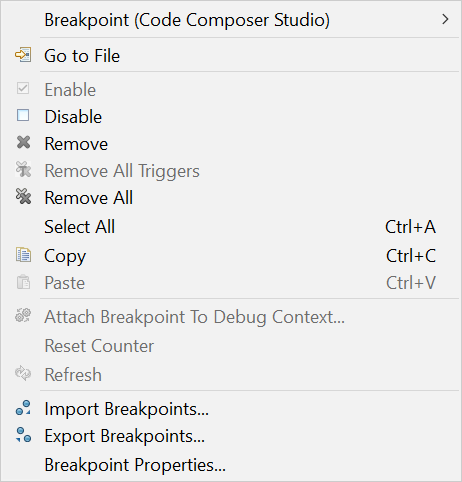
The toolbar contains various options.

A simple Terminal view is avaiable to perform serial or networked communications from inside the CCS IDE. Details about this are available at the reference below:
Advanced graph and image visualization tools are available in CCS. These tools can display arrays of data in graphical format in both time and frequency domains and accept various data types (integer, floating point, Q-values, real, complex, etc.) as well as Image Analyzer.
Check the pages below:
The Cache view shows the cache configuration of the C6000 DSP core, separated by type of cache and ordered by memory address. It contains various fields displayed in a spreadsheet format.
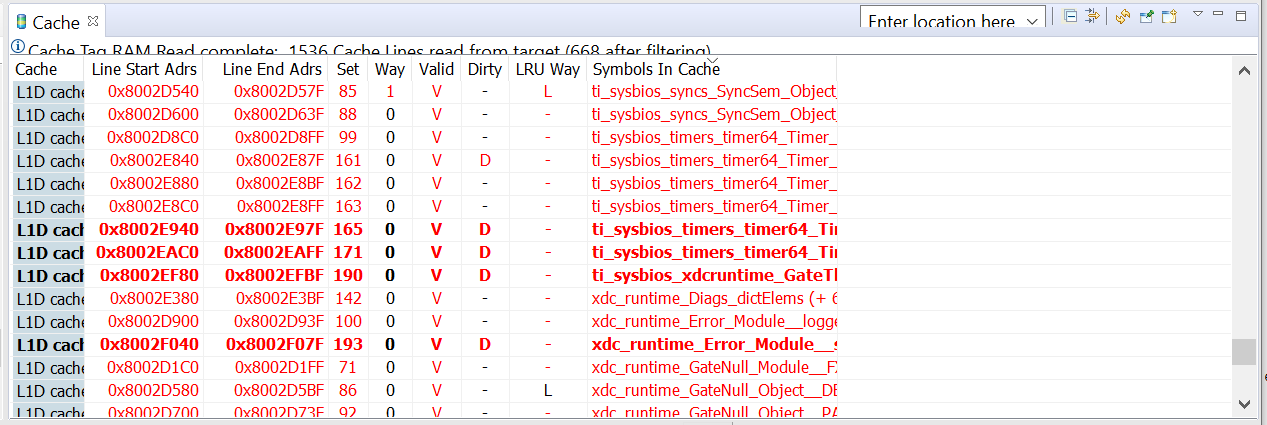
The columns are:
Right-clicking on the Cache view shows the following options:
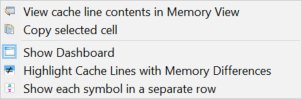
The toolbar contains various options:

The ability to measure low-level code performance by counting cycles is available through the Profile Clock tool. Details about this feature can be seen at the reference below:
CCS is able to import and export data in a few file formats, including COFF, flat binary format and TI DAT.
The Common Object File Format or COFF for short, is a binary file format used for object code, libraries, and executables, originated on Unix systems. TI uses this file format with modifications optimal for embedded systems.
Additional details and references can be found in the TI Assembly Language Tools User's Guides or on the COFF Wikipedia page.
The Binary format has no specified header or translation. It is a simple bitstream of data with no information about symbols, address placement, or relocation. The length of the data is equal to the length of the file.
One important aspect: when creating binary files using tiobj2bin or objcopy from a project, care must be taken to place all initialized code/data in adjacent memory locations. Any holes are filled with zeros. If a file with zero-filled gaps is loaded to a device, it may trigger invalid memory access errors.
The TI Raw Data Format is identical to the Binary Format above.
A text file that contains one line of header information and stores the data as one sample per line.
The header information for data files uses this syntax:
| MagicNumber | Format | StartingAddress | PageNum | Length | SubFormat |
The Format types 1 through 4 are used by older versions of CCS and should be used only for legacy compatibility. The current versions only use format type 9 with the extended data type.
The table below shows a list of supported extended data types per target.
The list can be obtained by connecting to a device or core, then opening the Scripting Console and issuing the command eval('GEL_MemoryListSupportedTypes(0)');
| ARM Cortex 32-bit | ARM Cortex 64-bit | F28x, PRU | C66x | MSP430 | |
|---|---|---|---|---|---|
| 0 | 32-Bit Hex - TI Style | 64-Bit Hex - TI Style | 8-Bit Hex - TI Style | 64-Bit Hex - TI Style | 32-Bit Hex - C Style |
| 1 | 32-Bit Hex - C Style | 64-Bit Hex - C Style | 8-Bit Hex - C Style | 64-Bit Hex - C Style | 32-Bit Hex - TI Style |
| 2 | 32-Bit Signed Int | 64-Bit Floating Point | 8-Bit Signed Int | 64-Bit Floating Point | 32-Bit Signed Int |
| 3 | 32-Bit UnSigned Int | 64-Bit Exponential Float | 8-Bit UnSigned Int | 64-Bit Exponential Float | 32-Bit UnSigned Int |
| 4 | 32-Bit Binary | 32-Bit Hex - TI Style | 8-Bit Binary | 32-Bit Hex - TI Style | 32-Bit Binary |
| 5 | 32-Bit Floating Point | 32-Bit Hex - C Style | Character | 32-Bit Hex - C Style | 32-Bit Floating Point |
| 6 | 32-Bit Exponential Float | 32-Bit Signed Int | Packed Char | 32-Bit Signed Int | 32-Bit Exponential Float |
| 7 | 16-Bit Hex - TI Style | 32-Bit UnSigned Int | 16-Bit Hex - C Style | 32-Bit UnSigned Int | 16-Bit Hex - C Style |
| 8 | 16-Bit Hex - C Style | 32-Bit Binary | 16-Bit Hex - TI Style | 32-Bit Binary | 16-Bit Hex - TI Style |
| 9 | 16-Bit Signed Int | 32-Bit Floating Point | 16-Bit Signed Int | 32-Bit Floating Point | 16-Bit Signed Int |
| 10 | 16-Bit UnSigned Int | 32-Bit Exponential Float | 16-Bit UnSigned Int | 32-Bit Exponential Float | 16-Bit UnSigned Int |
| 11 | 16-Bit Binary | 16-Bit Hex - TI Style | 16-Bit Binary | 16-Bit Hex - TI Style | 16-Bit Binary |
| 12 | 8-Bit Hex - TI Style | 16-Bit Hex - C Style | 32-Bit Signed Int | 16-Bit Hex - C Style | 8-Bit Hex - C Style |
| 13 | 8-Bit Hex - C Style | 16-Bit Signed Int | 32-Bit UnSigned Int | 16-Bit Signed Int | 8-Bit Hex - TI Style |
| 14 | 8-Bit Signed Int | 16-Bit UnSigned Int | 32-Bit Hex - C Style | 16-Bit UnSigned Int | 8-Bit Signed Int |
| 15 | 8-Bit UnSigned Int | 16-Bit Binary | 32-Bit Hex - TI Style | 16-Bit Binary | 8-Bit UnSigned Int |
| 16 | 8-Bit Binary | 8-Bit Hex - TI Style | 32-Bit Floating Point | 8-Bit Hex - TI Style | 8-Bit Binary |
| 17 | Character | 8-Bit Hex - C Style | 32-Bit Exponential Float | 8-Bit Hex - C Style | Character |
| 18 | 64-Bit Hex - TI Style | 8-Bit Signed Int | 32-Bit IEEE Floating Point | 8-Bit Signed Int | |
| 19 | 64-Bit Hex - C Style | 8-Bit UnSigned Int | 32-Bit IEEE Exp'l Float | 8-Bit UnSigned Int | |
| 20 | 64-Bit Signed Int | 8-Bit Binary | 64-Bit Hex - C Style | 8-Bit Binary | |
| 21 | 64-Bit UnSigned Int | Character | 64-Bit Hex - TI Style | Character | |
| 22 | 64-Bit Floating Point | Packed Char | 64-Bit Floating Point | Packed Char | |
| 23 | 64-Bit Exponential Float | 64-Bit Exponential Float |
When debugging the application, the target may be halted (either intentionally or unintentionally) within a routine in one of the libraries linked to the application. In such cases, the editor view will display the message Can’t find a source file at… or No source available for…. In most cases, there will also be two buttons named View Disassembly… and Locate File….
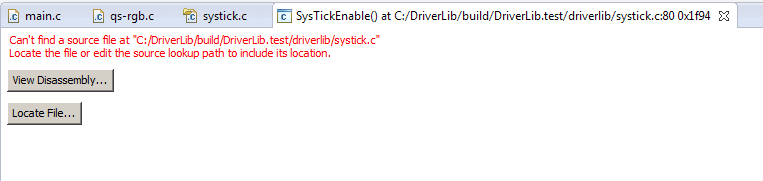
The reason for the message is that the program is halted at a location where the debugger is unable to locate the corresponding source file. This is typical when halted within a library that was built outside of the current project.
This type of message can occur when halted within any library, including the C runtime library, BIOS libraries, driverlibs, or other custom libraries linked to the project.
Some situations when the message will appear:
The message itself is typically harmless and can be ignored. If it is required to do source level debugging of the library code, the debugger can point to the location of the source file by clicking on Locate File… and browsing to the location where the source file resides (a directory, a mounted remote drive, etc.).
Libraries from TI such as the C runtime library, driverlib (part of SimpleLink SDKs, C2000Ware, MSPWare, TivaWare etc.) often come with the source, so these directories can be specified to the debugger.
If you do not have access to the source, you can still view and step through the disassembly code by clicking on View Disassembly….
Without the source file correlation, the debugger will also be unable to set breakpoints within a library routine from the editor view. For example, if you open a source file that is part of a library and try to set a breakpoint in it from the editor view without making the correlation between the debugger and source file, then the breakpoint will not be enabled. You can still set the breakpoint from the Breakpoints view by specifying the symbol name or associated address. Then when the program is halted at the breakpoint, you can click on the Locate File… button to tell the debugger where the source files are located. Once the association with the source is made, you should then be able to set future breakpoints from the editor view.
Besides the Locate File… button, there are a couple of other ways to tell the debugger where to look for sources that are not part of the project. Please see slides 51-55 of the CCS Tips and Tricks presentation.
If your program is compiled with optimization enabled, that will impact the debug experience. The higher the level of optimization, the more it will degrade the ease of debugging. Please see this article about tradeoff between debug and optimization: Debug versus Optimization Tradeoff
Trace is an advanced debugging capability that allows capturing code execution and system events in real-time. It can be an invaluable tool to detect complex, intermittent bugs and to profile and fine tune code performance.
There are several types of trace available with CCS:
The availability of each type of trace can vary depending on the device and debug probe used.
Core Trace (also referred to as "Processor", "Instruction", or "CPU" Trace) is an advanced debug feature that performs real-time gathering of all instructions being executed by the core. A timestamp is stored with each instuction. The collected trace data is then sent to CCS for further post processing and displayed in the CCS trace views. CCS can correlate the instructions with the source code and thus allows for looking the code execution more easily. The ability to see the program's execution history allows for finding places where the code behaves erratically or took an unexpected branch.
In addition, the collected trace data can be used to perform a multitude of other operations. The most commonly supported ones are:
Other operations may be supported, depending on the device and version of CCS.
Since the execution speed of modern processors can reach billions of instructions per second, it is impossible to gather all this information without special hardware and some buffering between the device and the host machine. Hence, core trace is not available in all devices. For the ones which have this feature, there are two implementations with different levels of complexity: Embedded Trace Buffer (or ETB) and Pin Trace using an external trace receiver pod.
Embedded Trace Buffer (or ETB) is a small memory area that is tightly coupled to the processing core of the device, and contains a copy of all the instructions executed by it. Due to its small size, the ETB is only able to capture a small sample of instructions that pass through the core. It can only operates in circular mode, which means that old instructions are overriden by newer ones. The advantage for the ETB is that it allows for performing core trace without the need for any extra specialized hardware, and works with any XDS based debug probe.
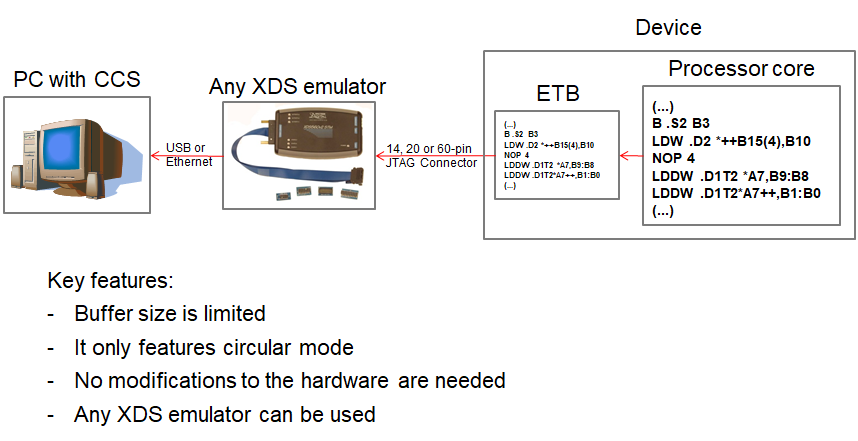
The ETB is available with the following cores:
Pin Trace is a technology that features a trace buffer outside of the device without losing the ability to capture all instructions that are executed by the processing core. Being outside of the device, the trace buffer can have any size and allows additional configurability such as operation in both circular and one-shot mode. The one-shot mode gives an additional degree of observability as it allows retrieving the exact history of execution up to a given point of interest. However, the fact the trace buffer is outside the device adds the requirement of having a high-speed communcations interface to capture all data, thus requiring additional specialized hardware on the device and target board, and limiting the choice of XDS debug probe to the more costly XDS PRO TRACE.
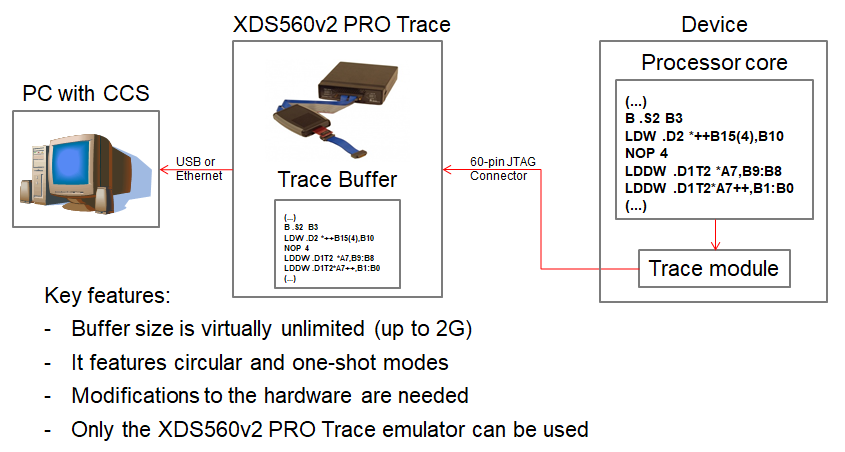
The availability of Pin Trace can vary depending on the device. Check the device documentation to see if Pin Trace is supported.
The CCS Trace Visualization Toolit (or TVT) can be used to configure trace collection and visualize the collected data. Note that not all devices that support core trace is supported by TVT.
Supported devices include:
For older devices, core trace functionality may be supported by the legacy Hardware Trace Analyzer tool. See the Hardware Trace Analyzer section for more details.
TVT can be accessed with the Code Analysis menu. Underneath this menu, there are three options:
To collect and display Core Trace data, select the Code Analysis → Core Trace menu item. This will open the Core Trace view and allow the user to configure the trace session:
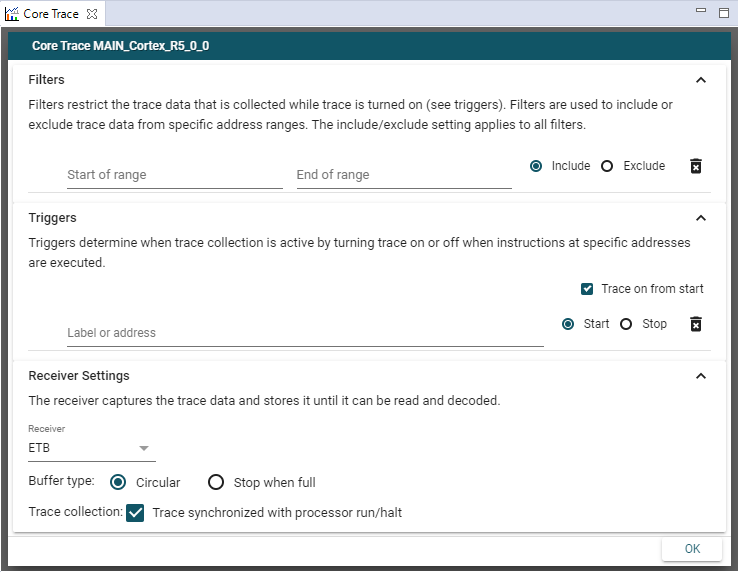
After trace is configured and the OK button is selected, the trace session will start. The target can be run and trace data will be collected according to how the trace session was configured. The trace session can be halted in a variety of ways. If the Trace synchronized with processor run/halt option is enabled, then session will automatically be halted when the target execution is halted. The trace session can also be manually halted when the STOP RECORDING button is pressed while the session is running. When the trace session is halted, all data stored in the trace buffer is sent to CCS over the existing JTAG connection, processed by TVT and displayed in the Core Trace view:
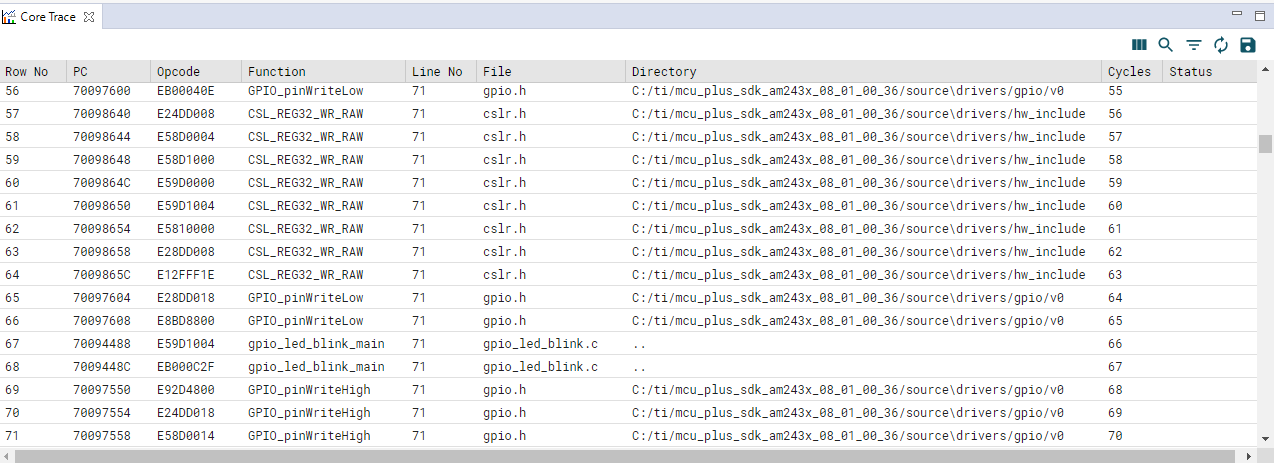
The follow columns are displayed for each trace entry:
Selecting an entry will attempt to open the associated source file in the editor and highlight the associated source line, and also jump to that address in the Disassembly view (if open).
The toolbar for the Core Trace view provides the following options:

For a short video on using TVT for Core Trace, please see: How to use CCS to capture trace data on an AM243x LaunchPad.
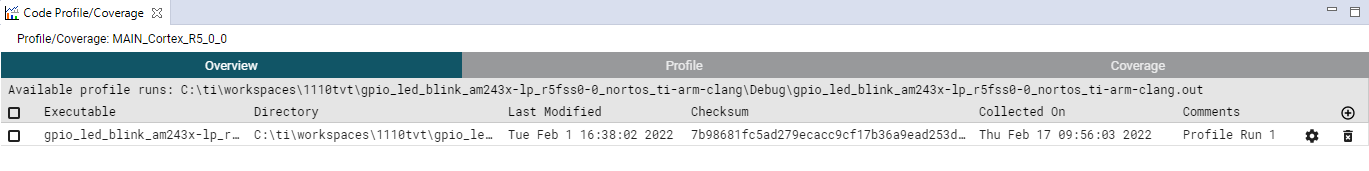
To collect and display Code Profile/Coverage data, select the Code Analysis → Core Profile/Coverage menu item. This will open the Code Profile/Coverage view.
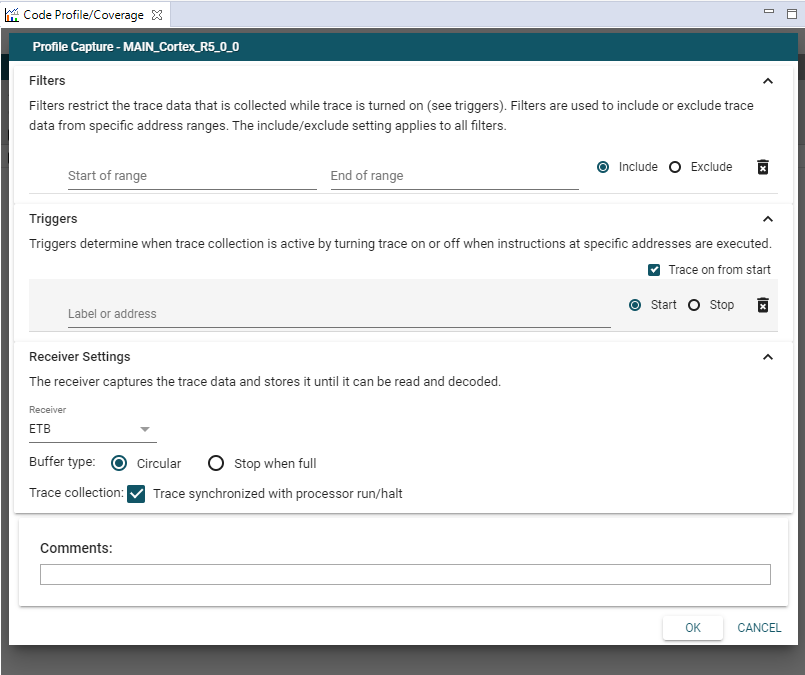
A new profile run can be created with the Add new profile/coverage run using trace button (the "+" symbol in a circle). Selecting this option opens the trace configuration settings. For more information on these settings, please see section above regarding Core Trace configuration. Note that there is one additional setting that was not previously available. It is the Comments field. It allows the user to enter a description for the profile run. This description is useful to differentiate between other previous profile runs listed in the Overview section.
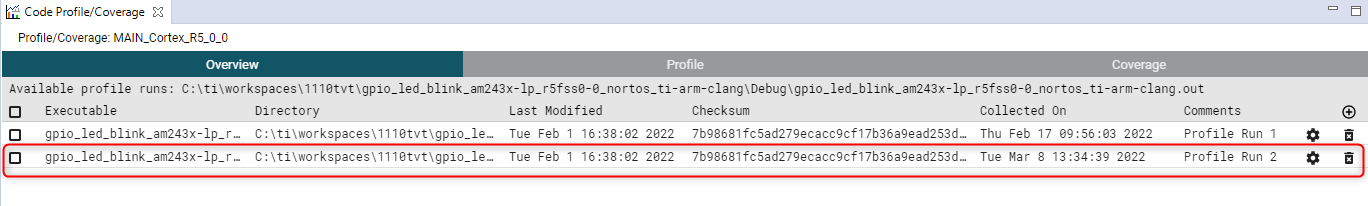
After trace is configured and the OK button is selected, the trace session will start. The behavior of the trace session will be the same as described with the Core Trace session. Once the trace session has been halted, a profile run for the session will appear in the Overview section.
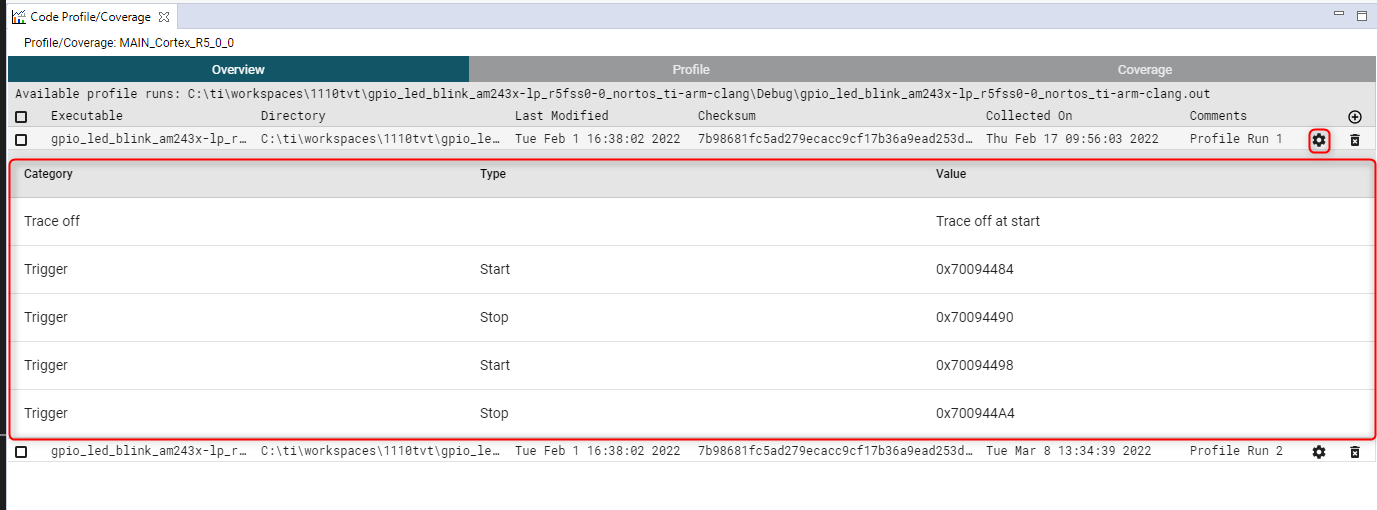
Information such as the Executable name, Directory of the executable, time Last Modified, the Checksum value, time the trace data was Collected On, and the Comments for each profile run is displayed. Pressing the settings button (first "gear" icon just to the right of the Comments) will display any custom options made in the trace configuration settings for the profile run. In the example below, several custom trace triggers were set:
The delete button ("trash" icon next to the settings icon) will delete the record for that profile run.
When a profile run is selected by checking the checkbox for the profile run (to the left of the Executable name), The Profile and Coverage sections will display the relevant information for that profile run.
The Profile section can display profiling data at the source file, function, and source line level.
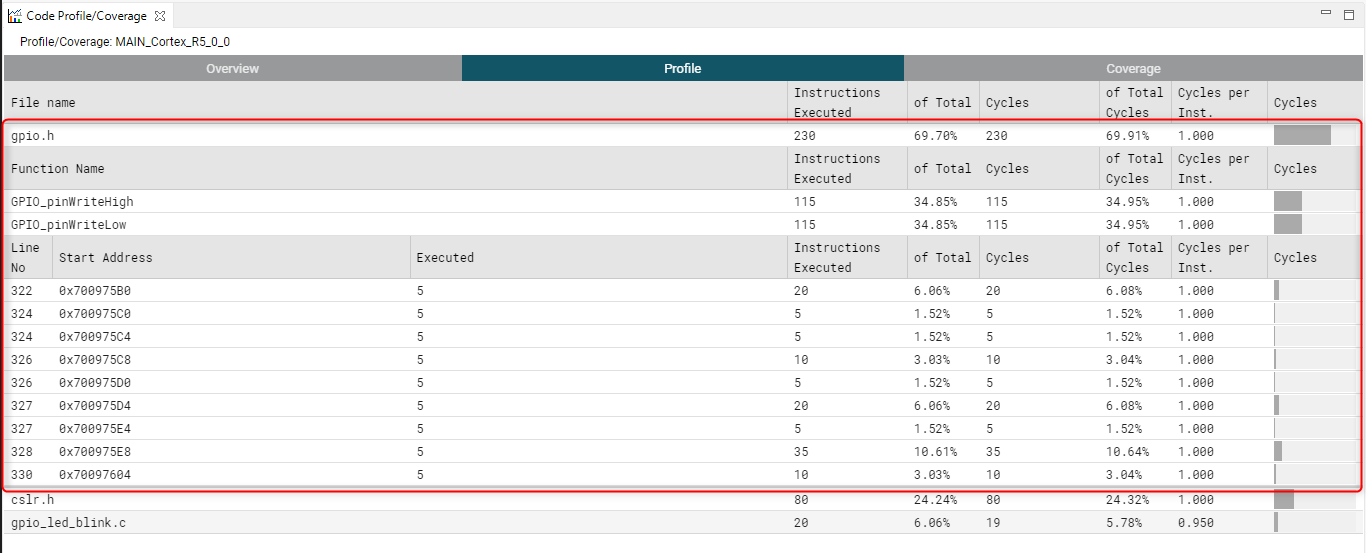
For each source file, the following information is displayed:
A source File Name can be selected to show the function level profiling data for that source file. The information shown is the same as what is shown at the file level, with the only difference being that it is on a per function level.
A Function Name can be selected to show the source line level profiling data for that function. The information shown is similar to what is shown at the file/function level, with the exception of three additional columns:
Some entries may repeat the same Line No, hence breaking up the total data for that source line into multiple entries. This is due to the way the trace data is categorized.
Selecting an entry at the source line level will attempt to open the associated source file in the editor and highlight the associated source line, and also jump to that address in the Disassembly view (if open).
The Coverage section can display code coverage data at the source file, function, and source line level.
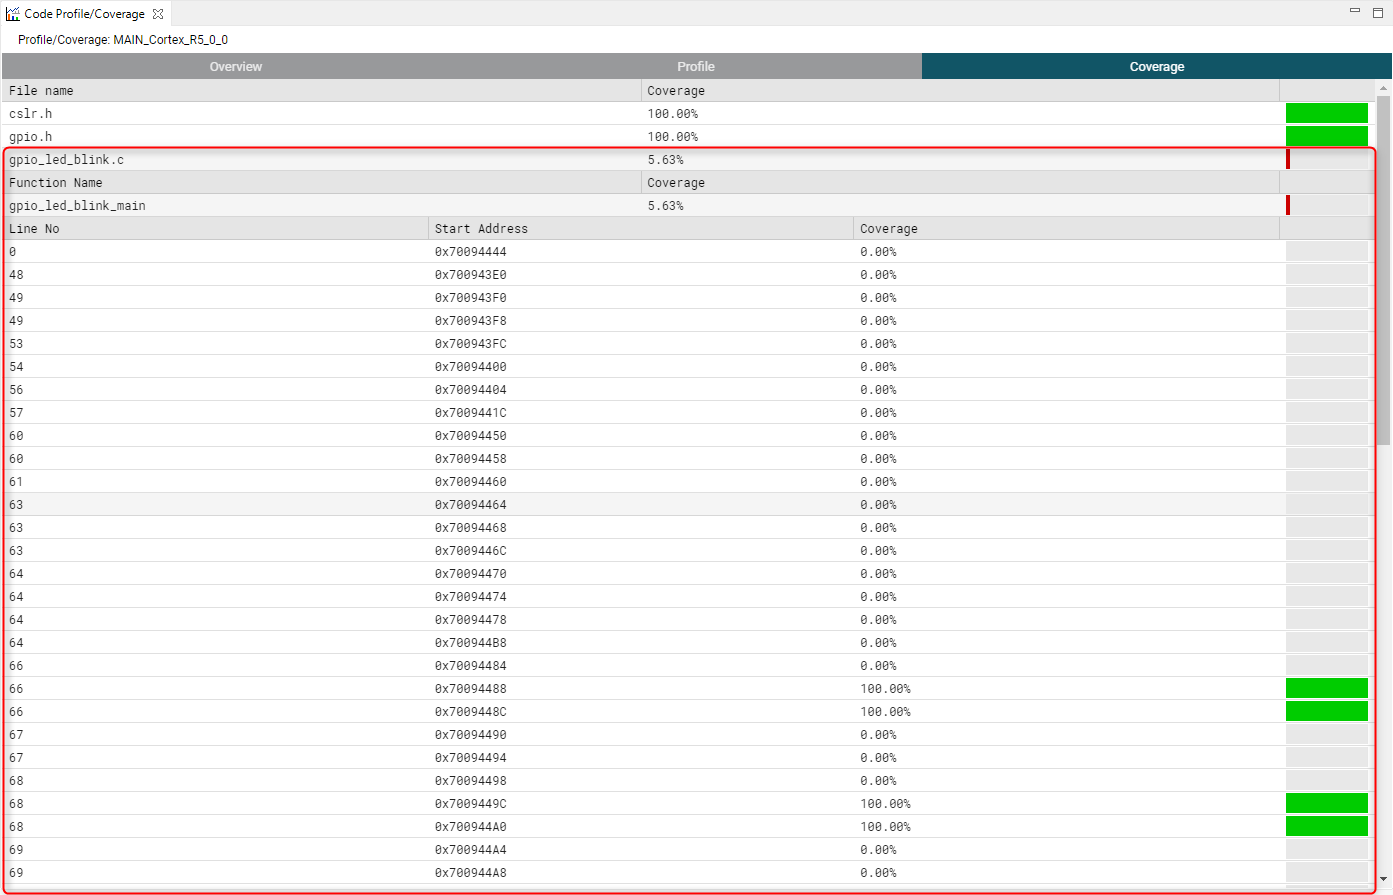
For each source file, the following information is displayed:
A source File Name can be selected to show the function level coverage data for that source file. The information shown is the same as what is shown at the file level, with the only difference being that it is on a per function level.
A Function Name can be selected to show the source line level coverage data for that function. The information shown is similar to what is shown at the file/function level, with the exception of three additional columns:
In the screenshot above, the gpio_led_blink.c file only has 5.63% coverage for the functions that were called within it. Expanding the file shows the gpio_led_blink_main function, which again shows 5.63% coverage. Expanding the function shows only lines 66 and 68 of the function have coverage. The reason for this is because this profile run was configured with various triggers to turn on/off trace at various addresses (as shown earlier). This explains why there is trace data for only a fraction of this function.
For a short video on using TVT for Code Profiling/Coverage, please see: How to use CCS to capture code profiling and coverage data on an AM243x LaunchPad.
For older devices that are not supported by TVT, core trace functionality may be available using the legacy Hardware Trace Analyzer tool. Please refer to the Trace Analyzer User’s Guide for more information.
System Trace is trace capability that monitors synchronization and timing between cores and on-chip peripherals. It provides system level visibility to software thread execution and hardware performance. Essentially, it is type of trace that monitors the entire device and not just the core processor. Please refer to the Trace Analyzer User’s Guide for more information.
SWO Trace is a single pin trace interface that is part of the Cortex M Coresight components. It supports profiling of hardware events such as periodic sampling of program counter, data variable reads and writes, interrupt entry and exit, counters, as well as application generated software messages. It is also fully integrated into CCS and supported on various Cortex M devices.
See the below article for more information on SWO Trace:
EnergyTrace™ technology is a power analyzer tool for CCS that measures and displays the energy profile of an application and helps optimize it for ultra-low-power consumption. The tool can be used standalone as a power profiling tool, or in EnergyTrace+ or EnergyTrace++ modes within a debug session for code analysis to help optimize the application for ultra-low-power consumption.
See the below article for more information on EnergyTrace:
MTB Trace provides a single execution trace capability for MSPM0+ devices - recording any PC discontinuities. It is similar to Core Trace, though much more limited in scope. The MTB uses SRAM to store the data and it is configured to store four entries.
To collect and display MTB Trace data, select the Code Analysis → MTB Trace menu item. This will open the MTB Trace view and allow the user to configure the Receiver settings for the trace session. The trace receiver captures the trace data and stores it until it can be read and decoded.
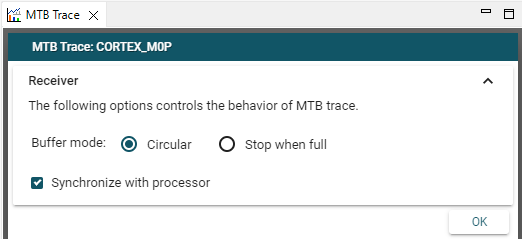
The following options are available for the Receiver settings:
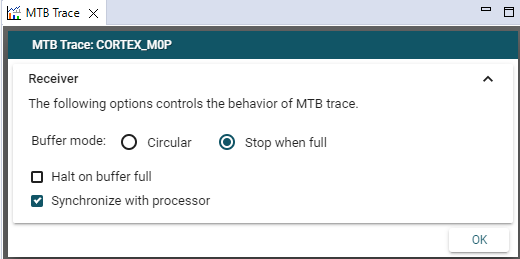
It is strongly recommend to set the Buffer mode to Circular due to the very small trace buffer size.
After trace is configured and the OK button is selected, the trace session will start. The target can be run and trace data will be collected according to how the trace session was configured. The trace session can be halted in a variety of ways. If the Synchronize with processor option is enabled, then session will automatically be halted when the target execution is halted. The trace session can also be manually halted when the STOP RECORDING button is pressed while the session is running. When the trace session is halted, all data stored in the trace buffer is sent to CCS over the existing JTAG connection, processed by TVT and displayed in the MTB Trace view:
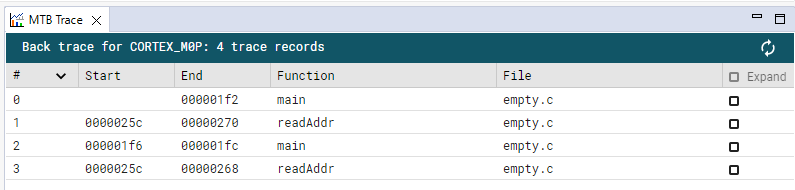
The follow columns are displayed for each trace entry:
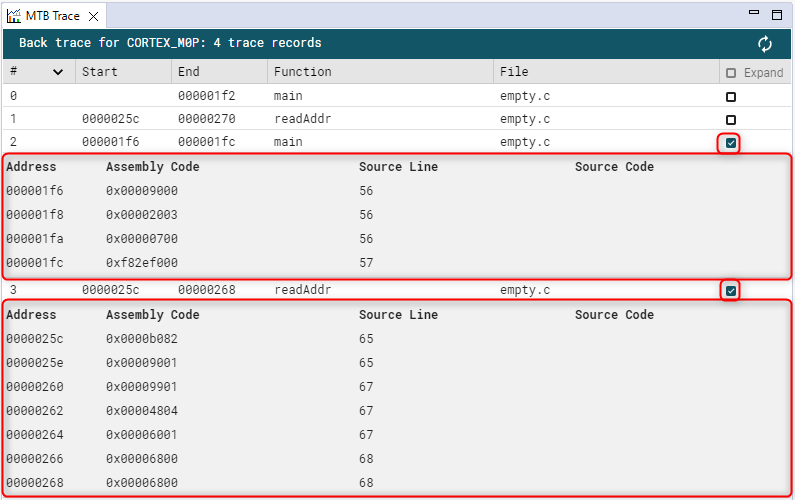
Selecting an entry will attempt to open the associated source file in the editor and highlight the associated source line, and also jump to that address in the Disassembly view (if open).
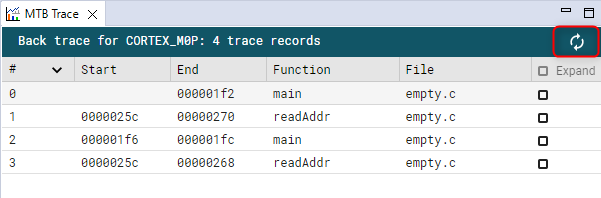
The toolbar for the MTB Trace view only has one button:
See the below article for more information on the MTB itself:
CCS has advanced functionality to support Multi-core debugging, including the ability to control multiple cores and devices either in symmetric or assymmetric fashion. Details are covered in the articles below:
CCS comes with an integrated On-Chip Flash Programmer. When a project is configured to use Flash memory regions of the device, the debugger automatically programs the Flash memory for those sections.
Only devices with internal memory are automatically programmed with the built-in flash programmer. External Flash IC devices (I2C, SPI, parallel NAND/NOR) must use a custom method to be programmed.
The flash memory related settings and operations can be accessed in a few ways:
To connect to the device prior to or even without loading a program, see the section Manual Launch .
A summary of options per device variant is shown in the next sections, but consult the device documentation for additional information.
The following settings/operations are supported for CC32xx devices:
Flash Settings:
Program Load - Erase Method: Sets the erase method when programming the device.
Erase: Manually erase the device's Flash memory.
Enable Verbose Output: Sets verbose mode output to the Console View .
The following settings/operations are supported for CC13xx and CC26xx devices:
Program Load Settings: Sets the erase method, and gives the option to perform blank check and calculate CRC32 on flash memory immediately after the operation.
Skip Sectors during Program Load: Allows specifying sectors that remain untouched during the Flash erase/program/verification. It can exclude sections based on its previous contents as well.
Customer Configuration (CCFG): Allows for setting various additional device configurations: - Keep CCFG data: Retains the upper N bytes of the device's CCFG. Consult the device's documentation for additional details. - Disable Bootloader: Disables the built-in device's bootloader - Lock debug interface: Prevents access to the debug interface after programming. This is not reversible and should not be used during the debug phase. - Write-protect sectors: Prevents overwriting of specific sectors using the Sectors option below.
Erase Actions: Manually erase the device's Flash memory. - Erase entire flash: Erases the entire Flash. The device must be reconnected after this operation. - Erase specific flash sectors: Erases the sectors specified by the Sectors option below. - The Flash can be manually erased by clicking on the Erase Flash button.
Device Information: When connected, allows gathering information about the connected device.
Device MAC Addresses: When connected, allows reading and setting the Primary BLE, Secondary BLE, Primary IEEE and Secondary IEEE addresses. Consult the device's documentation for additional details.
Enable Verbose Output: Sets verbose mode output to the Console View
The following settings/operations are supported for MSP432 devices:
Program Load Settings: Sets the erase method and gives the option to perform blank check and calculate CRC32 on flash memory immediately after the operation.
Erase Configuration: Specifies the various memory types to be erased during Flash programming.
Warning This option should NOT be used to load two different programs (such as a bootloader program and application program), as it might erase the first program when loading the second program, and it will also slow down programming as it will try to compare two totally separate programs unnecessarily.
Allow BSL information memory erase: Allows access to the BSL memory region. This is used to create custom BSL code.
Perform CRC verification: Performs a CRC calculation of the entire Flash contents.
Perform Blank Check: Performs a verification if the entire Flash is blank.
Device Security Configuration: Locks the device permanently or a single time.
Enable Verbose Output: Sets verbose mode output to the Console View
The following settings/operations are supported for TM4C devices:
Flash Settings:
Program Load Settings: Sets the erase method and gives the option to perform blank check and calculate CRC32 on flash memory immediately after the operation.
Erase: Specifies the various memory ranges to be erased during Flash programming.
Blank Check: Performs a verification if the Flash is blank. Defaults to the entire flash but can be set for a specified address range.
CRC32: Performs a CRC32 calculation on the Flash contents. Defaults to perform this on the entire flash but can be set for a specified address range.
User Register Programming: Allows direct programming of the non-volatile User registers (USER_REG0 and USER_REG1).
MAC Address Mode: Programs the User registers above in the format of an Ethernet MAC address.
Debug Port Unlock: Allows the JTAG/SWD debug pins to be unlocked if you configure the pins as GPIOs or there is some other issue that causes the device to lock up, such as configuring the system clock out of specification.
ICDI Firmware Update: Can be used to update the ICDI firmware for boards that use a TM4C123-based ICDI Debug Probe. For the last three settings, refer to the LMFlash Programmer Help for more information.
Device Information: When connected, allows gathering information about the connected device.
Enable Verbose Output: Aets verbose mode output to the Console View .
The following settings/operations are supported for F28x devices:
Clock/PLL Settings: These options are critical to configure the device's System Frequency for Flash operations.
Download Settings: These options control the actions to be executed.
Range Avoidance Settings: Allows specifying ranges that are left untouched by the Flash programmer.
Performance Settings: Enables faster Flash programming by combining memory sections. The use of this option has several tradeoffs shown in the dialog box. Consult the device's documentation for additional details.
Erase Settings: Specifies the various memory ranges to be erased during Flash programming.
Blank Check Settings: Performs a verification if the Flash is blank.
Security Settings: Used to program the code security password and other security settings for the various peripherals and memory.
Enable Verbose Output: Sets verbose mode output to the Console View .
Backup RAM during Flash Programming/Operations: Creates a backup copy of the RAM contents during Flash operations.
The following settings/operations are supported for MSP430 devices:
Target Voltage (mV): Sets the voltage used by the target device.
Download Options: Sets options specific to certain devices.
Flash Settings
Program Load Settings: Sets the erase method and gives the option to perform blank check and calculate CRC32 on flash memory immediately after the operation.
Erase Options: Specifies the various memory types to be erased during Flash programming.
Warning This option should NOT be used to load two different programs (such as a bootloader program and application program), as it might erase the first program when loading the second program, and it will also slow down programming as it will try to compare two totally separate programs unnecessarily.
Erase Settings: Sets the Start Address and the End Address when the option By Address Range above is selected.
Device Information: When connected, allows gathering information about the connected device.
Enable Verbose Output: Sets verbose mode output to the Console View
The following settings/operations are supported for Hercules devices:
Flash Settings:
Flash verification settings:
Program Load Settings: Sets the erase method and gives the option to perform blank check and calculate CRC32 on flash memory immediately after the operation.
Blank Check Options: Performs a verification if the Flash is blank. Can be manually done via the Blank Check button or enable an automatic verification before the program is Flashed.
Erase Options: Specifies the various memory ranges to be erased during Flash programming.
Flash Profiling: Sllows performing a complete profile of code previously loaded to the Flash and track for possible errors or inconsistencies when compared to a correct executable. It can also be useful to validate different Flash programming tools apart from CCS. Consult the device's documentation for additional details.
Enable Verbose Output: Sets verbose mode output to the Console View .
Most of the devices have a single core. However, in SoC devices usually one of the cores is the primary (usually an ARM) and controls one or more additional (secondary) cores. In these cases, it is impossible to load and debug code in the secondary cores without previous intervention from the primary core, which is not only responsible for releasing the secondary cores from reset, but can also initialize PLLs and external memory interfaces (EMIF).
The status of the cores of the SoC can be inspected using the Target Status view.
Real-time mode is a special feature of selected devices and configurable via the CCS debugger that allows developers to halt and examine the program and its memory without blocking the service of any critical pre-configured interrupts.
The devices that support official Real-time mode are all TI C55x, C64x, C674x, C66x and F28x devices through a built-in module called ICEMaker. ARM Cortex based devices support do not support full real-time mode. But they do support real-time (non-intrusive) memory accesses.
Real-time mode is mostly used by F28x developers operating with high power systems, thus usage references for this device family can be seen at the following topics:
The Advanced tab of the Target Configuration Editor has a set of common configurations and a few items specific to each Debug Probe. Below follows a short list of the configurations present for each model and variant.
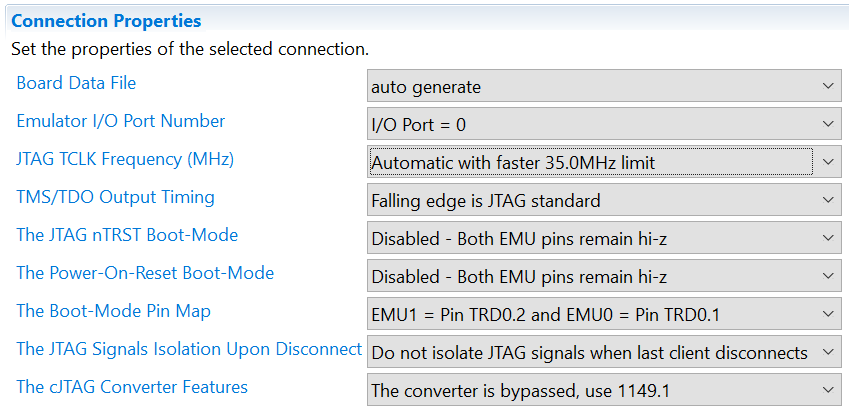
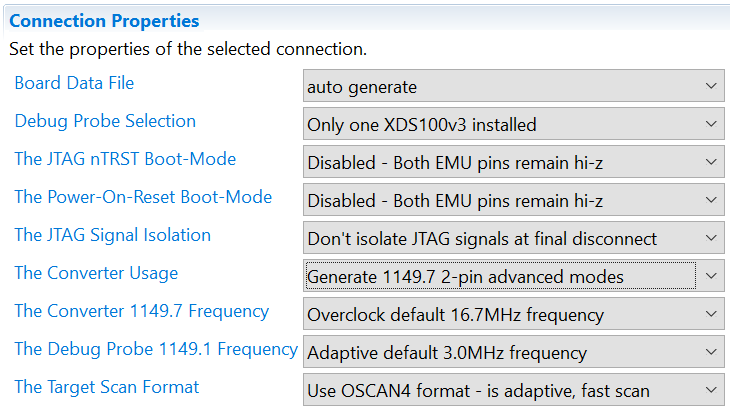
The XDS100v3 adds the following options: